Descripción
Puntos RSI SC
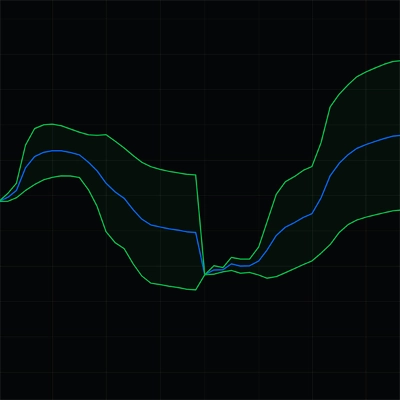
Indicador RSI minimalista que utiliza puntos dinámicos para una visualización del momentum más limpia y rápida.
Puntos RSI SC es una interpretación minimalista del clásico RSI (Índice de Fuerza Relativa), diseñado para proporcionar una vista más limpia e intuitiva del momentum del mercado sin saturar el gráfico con líneas innecesarias.
En lugar de mostrar la línea tradicional del RSI, el indicador utiliza puntos dinámicos para representar los valores del RSI a lo largo del tiempo.
Este enfoque crea un diseño de gráfico más limpio y moderno que es más fácil de leer, especialmente para los traders que usan múltiples herramientas simultáneamente.
Características clave
- RSI mostrado usando puntos en lugar de líneas
- Apariencia del gráfico más limpia y menos distractora
- Visualización dinámica del color basada en la posición del RSI
- Color dedicado para condiciones de sobreventa
- Color dedicado para condiciones de sobrecompra
- Intensidad progresiva del color a medida que el RSI se acerca a niveles extremos
- Identificación visual instantánea de cambios en el momentum
- Reconocimiento rápido de la fortaleza y debilidad del mercado
- Ideal para scalping, trading intradía y trading discrecional
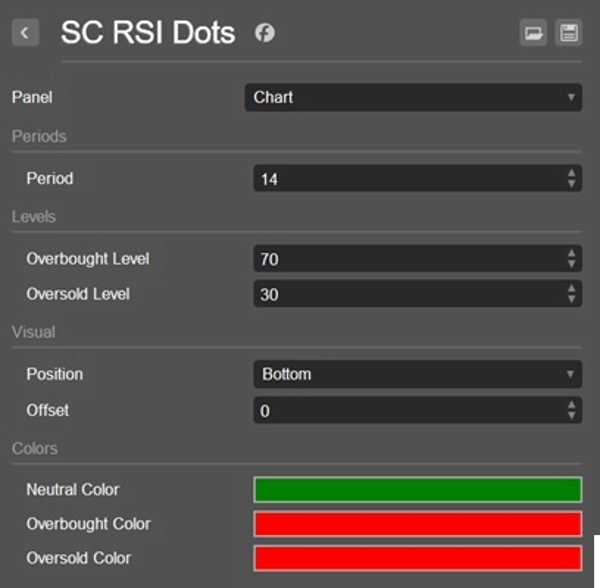
Cómo funciona el sistema de colores
Puntos RSI SC utiliza un motor de color dinámico para simplificar la interpretación del RSI.
- Un color dedicado identifica condiciones de sobreventa.
- Un color dedicado identifica condiciones de sobrecompra.
- Entre estas dos zonas, la intensidad del color aumenta gradualmente a medida que el RSI se acerca a cualquiera de los extremos.
Este enfoque visual permite a los traders entender instantáneamente dónde se está desarrollando el momentum sin tener que monitorear constantemente una línea osciladora tradicional.
El resultado es una lectura más rápida e intuitiva de las condiciones del RSI directamente desde el gráfico.
Por qué usar Puntos RSI SC
Los indicadores RSI tradicionales a menudo requieren que los traders monitoreen continuamente la línea osciladora y su interacción con los niveles de sobrecompra y sobreventa.
Puntos RSI SC fue creado con un objetivo en mente:
mantener el gráfico visualmente limpio mientras se proporciona toda la información esencial sobre el momentum y las condiciones del mercado.
La visualización adaptativa de puntos facilita el reconocimiento de:
- Incremento del momentum alcista
- Incremento del momentum bajista
- Aproximación a condiciones de sobrecompra
- Aproximación a condiciones de sobreventa
- Posible agotamiento del momentum
Todo esto sin la distracción de líneas adicionales en la pantalla.
Perfecto para
- Traders que prefieren gráficos limpios
- Traders de momentum
- Traders de acción del precio
- Scalpers y traders intradía
- Configuraciones de trading con múltiples indicadores
- Análisis rápido del mercado
Nota importante
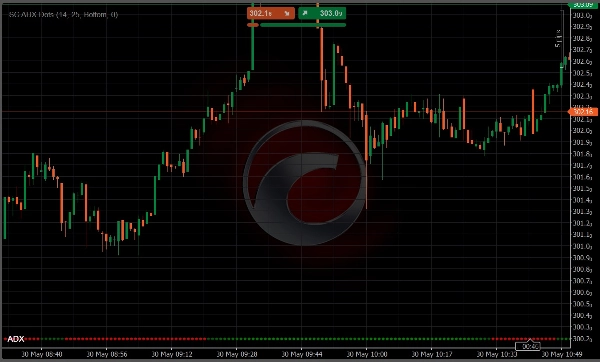
Puntos RSI SC está diseñado para usarse directamente en el gráfico principal de precios.
A diferencia de los indicadores RSI tradicionales, su concepto visual está construido alrededor de integrar la información del momentum en el análisis de la acción del precio. Por esta razón, no se recomienda usar el indicador en un panel separado y no proporciona la experiencia de usuario prevista.
Simple. Limpio. Intuitivo.
Resumen
Key features include:
- RSI values represented by dots with dynamic colors reflecting momentum strength.
- Distinct colors for oversold and overbought conditions.
- Progressive color intensity indicating proximity to extreme RSI levels.
- Instant visual cues for momentum shifts, market strength, and weakness.
The indicator is suitable for scalping, intraday, momentum, and price action traders who prefer clean charts and use multiple tools simultaneously. It supports visualization of reversal signals, trend strength, and level touches or breaks based on RSI behavior. SC RSI Dots is intended for use on the main price chart rather than a separate panel, enhancing direct correlation between momentum and price movements.
Valoraciones de clientes
5 | 100 % | |
4 | 0 % | |
3 | 0 % | |
2 | 0 % | |
1 | 0 % |