
Ichimoku Kinko Hyo
Индикатор
155 скачивания
Версия 1.0, Jul 2025
Windows, Mac
5.0
Отзывы: 1
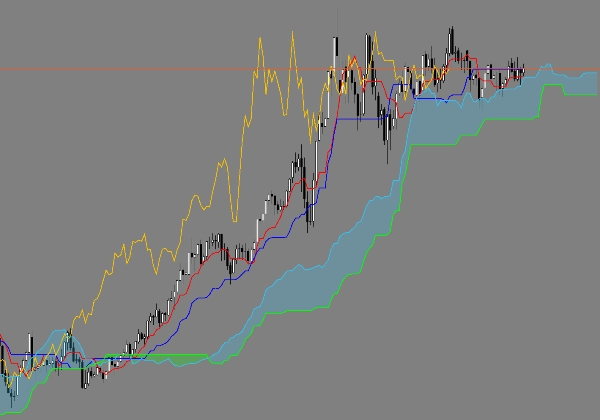
Описание
Это исправленный индикатор Ichimoku Kinkō Hyō для cTrader. По умолчанию смещение в cTrader составляет 26 и начинается с нуля, что приводит к неправильному смещению Chikou Span и Kumo (облако). Эта версия исправляет это, используя фиксированное смещение на 25 периодов как для Chikou Span (перемещённого на 25 периодов назад), так и для линий Kumo (перемещённых на 25 периодов вперёд), что соответствует оригинальной японской спецификации и платформам, таким как TradingView. Это гарантирует, что все линии Ichimoku рассчитываются и отображаются в правильных позициях для точных сигналов и анализа.
Сводка
ИИ-сводка
This product is a corrected Ichimoku Kinkō Hyō indicator designed for the cTrader platform. It addresses an issue in cTrader’s default Ichimoku implementation, where the displacement is set to 26 and counted from zero, causing misalignment of the Chikou Span and Kumo (cloud) lines. This version applies a fixed 25-period shift: the Chikou Span is moved 25 periods backward, and the Kumo lines are shifted 25 periods forward. This adjustment aligns the indicator’s calculations and plotting with the original Japanese Ichimoku specification and other platforms like TradingView. The correction ensures that all Ichimoku lines are displayed in their proper positions, supporting accurate technical analysis and signal interpretation.
Профиль индикатора
Отзывы покупателей
5.0
Отзывы: 1
5 | 100 % | |
4 | 0 % | |
3 | 0 % | |
2 | 0 % | |
1 | 0 % |
Обсуждение
Частые вопросы
Продукты, доступные в cTrader Store, включая торговых ботов, индикаторы и плагины, предоставляются сторонними разработчиками и доступны исключительно в информационных и технических целях. cTrader Store не является брокером и не предоставляет инвестиционные консультации, персональные рекомендации или какие-либо гарантии будущей доходности.


Цена
С 20/03/2025
155
Бесплатные установки