الوصف
دليل تعليمات PROPFOLIO MASTER SUITE
المنصة: cTrader الإصدار: 1.0 (إصدار متوافق مع المتجر) مشغل بواسطة: Propfolio Solutions
مرحبًا بك في لوحة تحكم PropFolio Peak Formation SMC. هذه مجموعة كاملة للرسم البياني المؤسسي مصممة لجلب مفاهيم المال الذكي (SMC)، وتتبع Beat The Market Maker (BTMM)، وتحليل ملف الحجم في مؤشر cTrader خفيف الوزن ومحسن للغاية.
📥 1. دليل التثبيت
- قم بتنزيل ملف
PropFolioPeakFormationSMCDashbaord.algo. - انقر نقرًا مزدوجًا على ملف
.algo. سيفتح cTrader تلقائيًا ويقوم بتثبيته. - افتح أي مخطط في cTrader.
- انقر بزر الماوس الأيمن على المخطط -> المؤشرات -> مخصص -> اختر PropFolioPeakFormationSMCDashbaord.
- انقر على موافق للتطبيق.
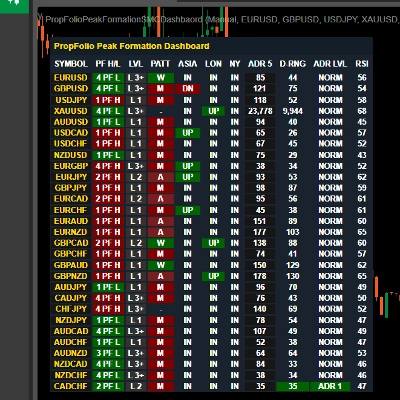
📊 2. شرح لوحة التحكم
تتميز المجموعة بلوحة تحكم متعددة الرموز تتتبع حالات السوق المؤسسية عبر 11 عمودًا في الوقت الحقيقي.
- الرمز: زوج العملات الذي يتم تتبعه. يمكنك تحديد قائمة مخصصة في إعدادات المؤشر.
- PF H/L (تشكيل القمة): يوضح ما إذا كانت دورة الـ 5 أيام الحالية في تشكيل قمة عالية (PFH) أو تشكيل قمة منخفضة (PFL)، وعدد الأيام التي مضت منذ تكوينها.
- LVL (المستوى): مستوى دورة BTMM الحالي (المستوى 1، المستوى 2، أو المستوى 3+).
- PATT (النمط): يحدد الأنماط المؤسسية داخل اليوم.
-
- M / W: تشكيلات M و W القياسية.
- A / V: قمم A وقواعد V.
- آسيا / لندن / نيويورك: يعرض حالة السعر الحالية بالنسبة لنطاق تلك الجلسة المحددة.
-
- صعود (أخضر): السعر اخترق فوق أعلى الجلسة.
- هبوط (أحمر): السعر اخترق تحت أدنى الجلسة.
- داخل (رمادي): السعر يتراوح داخل صندوق الجلسة.
- ADR 5: متوسط النطاق اليومي خلال آخر 5 أيام (بالنقاط).
- نطاق اليوم: نطاق اليوم الحالي (بالنقاط).
- مستوى ADR: يوضح ما إذا كان اليوم الحالي قد استنفد متوسط النطاق اليومي.
-
- عادي: نطاق عادي.
- ADR 1 / 2 / 3: السعر تجاوز 1x، 2x، أو 3x من حجمه اليومي العادي (توقع استنفاد/انعكاسات).
- مؤشر القوة النسبية (RSI): مؤشر القوة النسبية لمدة 15 دقيقة لرصد سريع لحالات الشراء المفرط (أحمر) أو البيع المفرط (أخضر).
👁️ 3. الرسوم البيانية وأدوات SMC
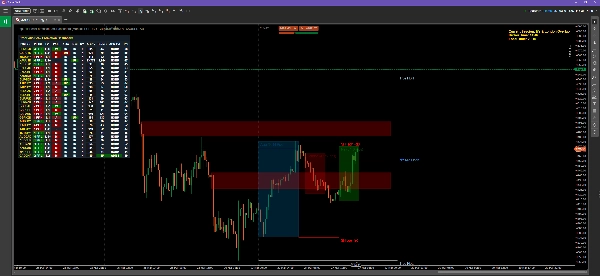
1. مناطق القتل (صناديق السيولة) يرسم المؤشر تلقائيًا صناديق شفافة لجلسات آسيا، لندن، ونيويورك. يتم تسمية حجم النقاط لكل صندوق في الأسفل.
2. خطوط صيد الإيقاف (BTMM) تُرسم خطوط على بعد 25 و50 نقطة فوق وتحت صندوق جلسة آسيا. هذه هي الأهداف المؤسسية حيث يصيد صانعو السوق أوامر وقف الخسارة للتجزئة قبل عكس الاتجاه.
3. أعلى وأدنى يوم حقيقي تشير الخطوط الفضية إلى أعلى يوم سابق حقيقي وأدنى يوم سابق، محسوبة بدقة من افتتاح آسيا الحقيقي إلى إغلاق نيويورك الحقيقي (مع تجاهل حجم التمرير الميت).
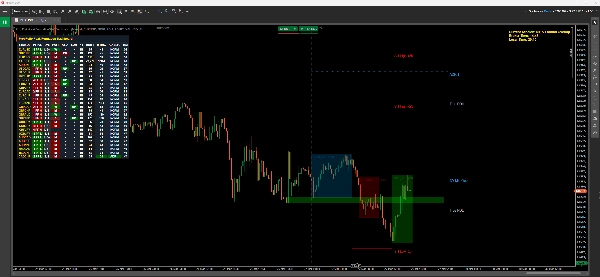
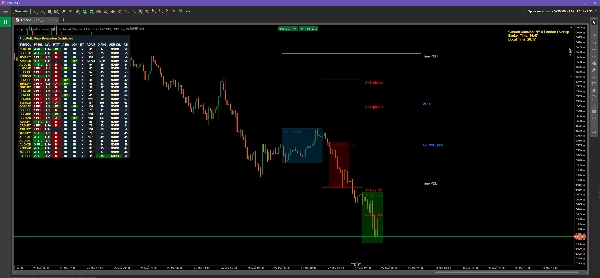
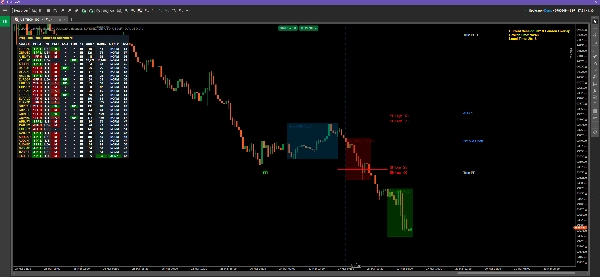
4. العرض والطلب (S&D) يفحص المحرك آخر 150 شمعة للعثور على عدم توازن مؤسسي.
- الصناديق الحمراء: عرض غير مخفف (مناطق البيع).
- الصناديق الخضراء: طلب غير مخفف (مناطق الشراء).
- ملاحظة: تختفي المناطق بمجرد أن يخفف السعر (يختبر) بالكامل.
5. خطوط هدف ADR بناءً على تشكيل القمة، يعرض المؤشر خطوطًا برتقالية أو زرقاء متقطعة تحدد أهداف استنفاد متوسط النطاق اليومي 1x، 2x، و3x لليوم.
📈 4. ملف الحجم (مرن مقابل ثابت)
يتميز المؤشر بمحرك ملف حجم مدمج بالكامل للعثور على نقطة التحكم (POC) ومنطقة القيمة العليا/الدنيا (VAH/VAL).
كيفية استخدام الوضع المرن:
- في إعدادات المؤشر، تأكد من تعيين وضع VP إلى
مرن. - ستظهر خطان متقططان عموديان بلون أزرق مائي على مخططك.
- ببساطة انقر واسحب هذه الخطوط لتحديد أي حركة سعرية على مخططك.
- سيحسب مخطط ملف الحجم، ونقطة التحكم، ومنطقة القيمة على الفور ويتماشى مع المنطقة الدقيقة بين الخطين!
كيفية استخدام الوضع الثابت: اضبط الوضع على ثابت يومي. سيحسب الملف تلقائيًا حجم التداول لليوم الحالي دون الحاجة إلى خطوط قابلة للسحب.
⚙️ 5. شاشة الوقت والتنبيهات
شاشة الوقت المتقدمة في الزاوية اليمنى العليا، سترى عرض نصي ذهبي. هذا يحسب تلقائيًا وقت الوسيط الخاص بك، ووقت جهاز الكمبيوتر المحلي الخاص بك، ويخبرك بالضبط أي جلسة تداول نشطة حاليًا (مثل "تداخل نيويورك ولندن").
تنبيهات الطرفية عند حدوث تشكيل قمة جديدة، سيتم طباعة إشعار مباشرة في علامة تبويب cTrader Automate -> Log حتى لا تفوت أي إعداد. ملاحظة: للحصول على إشعارات دفع خارجية متقدمة، يرجى زيارة ملف مطور Propfolio Solutions الخاص بنا للتعرف على المجموعة الموسعة.
الملخص
تقييمات العملاء
5 | 100 % | |
4 | 0 % | |
3 | 0 % | |
2 | 0 % | |
1 | 0 % |