الوصف
فوتبرينت برو — مخطط تجمع العطاء والطلب
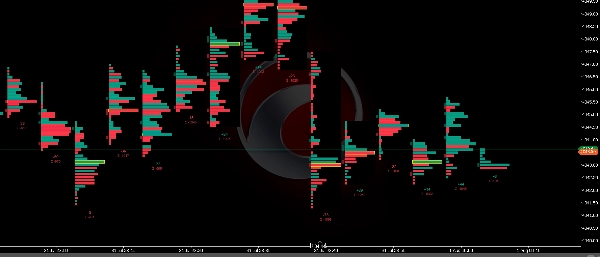
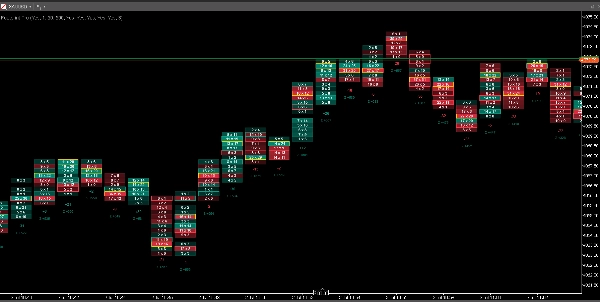
الشموع تخبرك إلى أين تحرك السعر. فوتبرينت يخبرك من الذي حركه. فوتبرينت برو يكسر كل شمعة إلى تجمعات سعرية مبنية على بيانات التيك الحقيقية، موضحًا بالضبط أين اشتبك المشترون والبائعون — ومن فاز.
هذا هو نوع تحليل تدفق الأوامر الذي عادةً ما يتطلب منصة مخصصة واشتراك شهري. فوتبرينت برو يجلبه بشكل أصلي إلى cTrader، كشراء لمرة واحدة.
🆕 الجديد في الإصدار 2
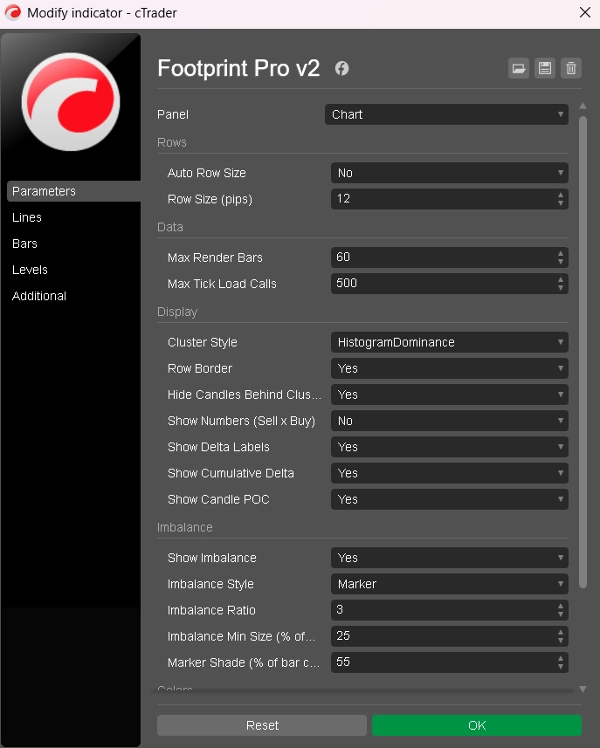
• تجمعات المدرج التكراري — كل صف يُرسم الآن كعمود طولُه يعبر عن حجمه، لذا تبرز الصفوف الأكثر نشاطًا دون الحاجة لفك تشفير درجات اللون. اختر لون هيمنة واحد، تقسيم شراء/بيع، أو احتفظ بالخريطة الحرارية الأصلية.
• حدود الصفوف بلون من اختيارك. اضبطها على خلفية الرسم البياني الخاص بك وتتفرق الصفوف إلى أعمدة واضحة ومتباعدة بشكل متساوٍ.
• اختلال توازن أنظف — العلامات الآن تجلس في الهامش بجانب الصف بدلاً من تأطيره، مع مفتاح تشغيل/إيقاف، وفلتر حجم أدنى بحيث يتم تعليم الصفوف التي تحمل وزنًا فقط، وظل لا يندمج أبدًا مع العمود المجاور.
• عرض تجمع موحد — كان فجوة الجلسة سابقًا قد تمدد تجمعًا واحدًا ليغطي جيرانه. الآن كل شمعة تحصل على نفس العرض.
• إعدادات افتراضية جديدة لمظهر أول أنظف: صفوف ثابتة بحجم 10 نقاط، نمط الهيمنة، الأرقام مغلقة. إعداداتك الحالية لم تمس.
🔍 ما تراه على كل شمعة
• تجمعات الحجم — كل شمعة مقسمة إلى صفوف سعرية، وكل صف يُرسم كعمود طولُه يعبر عن حجم التداول فيه. الصف الأكثر نشاطًا واضح للوهلة الأولى، دون الحاجة لفك تشفير الألوان.
• ثلاثة أنماط تجمع — الهيمنة (لون واحد لكل صف، القراءة الأنظف)، تقسيم شراء/بيع (كل عمود مقسم إلى حجم البيع والشراء)، أو خريطة حرارية (عرض كامل، الكثافة حسب النشاط).
• أرقام بيع × شراء — قم بالتكبير ويمكن لكل صف عرض عدد التيكات الدقيقة للبيع والشراء، مصنفة حسب حركة التيك الحقيقية الصاعدة/الهابطة.
• نقطة السيطرة على الشمعة — صف السعر الأكثر نشاطًا في كل شمعة، محدد باللون الذهبي.
• دلتا — صافي الشراء مقابل البيع لكل شمعة، مطبوع تحت كل عمود.
• دلتا تراكمية — دلتا الجلسة الجارية (Σ) تحت كل شمعة، تعيد التعيين يوميًا. اكتشف التباينات: ارتفاع السعر بينما Σ ينخفض هو تحذير لا يمكن أن يعطيه لك أي مخطط شموع.
• علامات الاختلال — حيث تتغلب العدوانية على الجانب المقابل بشكل قطري، تظهر علامة في الهامش بجانب الصف. العلامات تقع خارج الأعمدة في عمودها الخاص، لذا يبقى التجمع نظيفًا، والعلامات المكدسة سهلة الرصد — غالبًا ما تشير إلى نشاط مؤسسي.
⚡ مبني من بيانات التيك الحقيقية
• كل تجمع مبني من تاريخ التيك الفعلي لدى وسيطك — وليس تقريبات الأعمدة.
• تحميل ذكي كسول: تتم معالجة الشموع المرئية فقط، في الخلفية، لذا لا يتجمد الرسم البياني أبدًا.
• تحديثات مباشرة: تجمعات الشمعة الحالية، والدلتا و Σ تتحدث تيكًا تيكًا أثناء التداول.
• تاريخ عميق: عند التمرير خارج بيانات التيك لدى وسيطك، يتحول فوتبرينت برو تلقائيًا إلى تقريب قائم على M1 ويعلم تلك الأعمدة بعلامة ≈ — لا مخططات فارغة، لا مفاجآت.
🎯 كيف يستخدمه المتداولون
• تأكيد الاختراقات: دلتا قوية واختلالات مكدسة في شمعة الاختراق تميز الحركات الحقيقية عن الفخاخ.
• تلاشي الإرهاق: حجم مرتفع مع دلتا متقلصة عند قمة/قاع تأرجح يشير إلى الامتصاص.
• قراءة التباين: ارتفاع السعر + انخفاض الدلتا التراكمية = ارتفاع بدون شراء حقيقي.
• تحسين الدخول: ادخل عند نقطة السيطرة على الشمعة أو مستويات الاختلال بدلاً من الأسعار العشوائية.
⚙️ قابل للتعديل بالكامل
• حجم الصف الثابت بالنقاط، أو حجم تلقائي يتكيف مع نطاق الرمز.
• حدود الصفوف بلونك الخاص — اضبطها على خلفية الرسم البياني وتتفرق الصفوف إلى أعمدة واضحة ومتباعدة بشكل متساوٍ.
• ضوابط الاختلال: تشغيل/إيقاف، علامة أو إطار، النسبة، وفلتر حجم أدنى بحيث يتم تعليم الصفوف التي تحمل وزنًا فعليًا فقط.
• تبديل الأرقام، تسميات الدلتا، الدلتا التراكمية ونقطة السيطرة على الشمعة بشكل مستقل.
• كل لون قابل للتخصيص، بالإضافة إلى حد العرض وحجم الخط.
• الشموع تُخفي تلقائيًا خلف التجمعات لمظهر فوتبرينت نظيف واحترافي.
🧪 جرب قبل أن تشتري
نسخة تجريبية مجانية متاحة — نفس المحرك، تعرض أحدث 15 شمعة. جربها على بيانات وسيطك أولاً، ثم قم بالترقية إلى النسخة الكاملة.
تعمل على أي رمز. الأفضل تجربتها على مخططات M1–M15. شراء لمرة واحدة، بدون اشتراك، تحديثات مجانية.
الملخص
The indicator updates live with tick-by-tick data and uses smart lazy loading to maintain chart performance. When tick data is unavailable, it switches to an approximate mode based on 1-minute bars, clearly marking these bars. Footprint Pro supports full customization of row sizing, display options (numbers, delta labels, POC, imbalances), color schemes, and imbalance sensitivity.
Traders use Footprint Pro to confirm breakouts, detect exhaustion and absorption, identify divergences between price and volume, and refine entry points based on volume clusters rather than arbitrary prices. It works on any symbol, is optimized for 1- to 15-minute charts, and is available as a one-time purchase with free updates. A free trial version displays the most recent 15 candles for evaluation.