
Descrizione
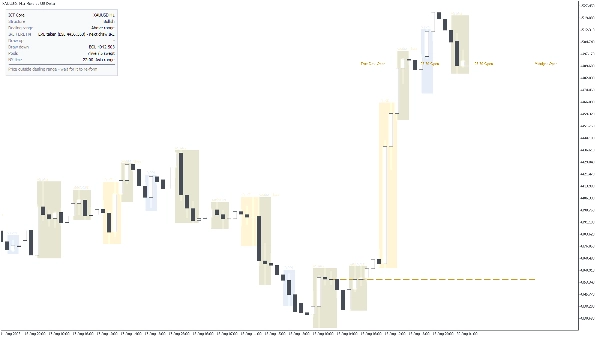
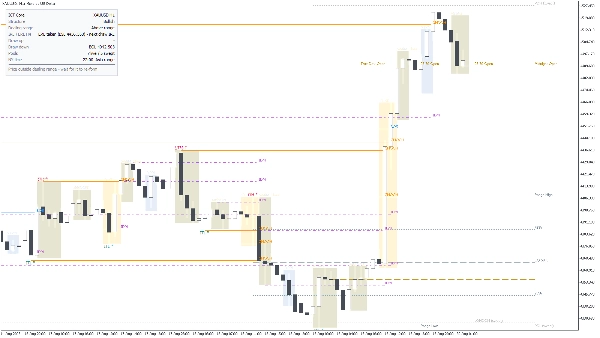
ICT Core trasforma un grafico dei prezzi grezzo in una lettura strutturata dei Concetti di Smart Money (ICT): struttura di mercato, pool di liquidità, intervallo di negoziazione, stato IRL / ERL, sessioni di New York e killzone, oltre a un pannello che indica il bias attuale e il piano condizionale in inglese semplice. Si basa solo su azioni di prezzo chiuse e confermate: una volta che un livello o un'etichetta è stampata, rimane dove si trova.
COSA ANALIZZA
ICT Core legge i dati delle barre (apertura / massimo / minimo / chiusura) dal simbolo del grafico, più un timeframe superiore a scelta (default H4) per la lettura IRL / ERL. L'ATR viene utilizzato per scalare la dimensione degli swing, la spaziatura delle etichette e la tolleranza per massimi / minimi uguali, così le stesse impostazioni si comportano in modo coerente su XAUUSD, indici e FX. Il timing delle sessioni e delle killzone è calcolato in orario di New York con gestione automatica dell'ora legale, non in orari fissi del broker.
COSA DISEGNA E COME LEGGERE
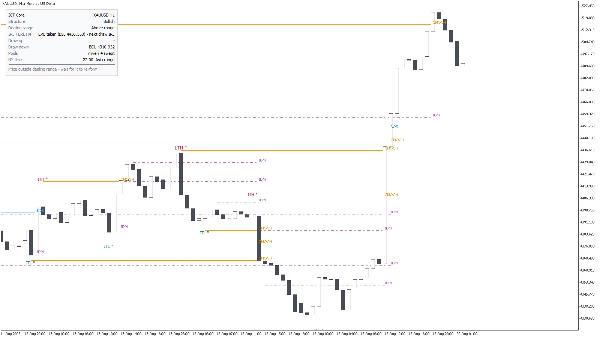
- Struttura di mercato. Gli swing sono classificati come a breve termine, medio termine e lungo termine. Le rotture sono etichettate BOS (continuazione) o CHOCH (cambio di carattere); una rottura fatta solo dalla coda è contrassegnata separatamente come sweep, così puoi distinguere uno spostamento reale da un raid. Massimi e minimi presi da una gamba impulsiva sono etichettati come forti / deboli.
- Induzione (IDM). Il massimo o minimo minore che il prezzo probabilmente raggiungerà prima del vero movimento è segnato, così puoi vedere la trappola prima che scatti.
- Pool di liquidità. Massimi e minimi del giorno precedente, della settimana precedente, del mese precedente, della sessione, e massimi / minimi uguali sono disegnati come livelli lato acquisto (BSL) e lato vendita (SSL). Una volta che un pool è sweepato, viene attenuato anziché cancellato, così la storia di ciò che è già stato preso rimane leggibile.
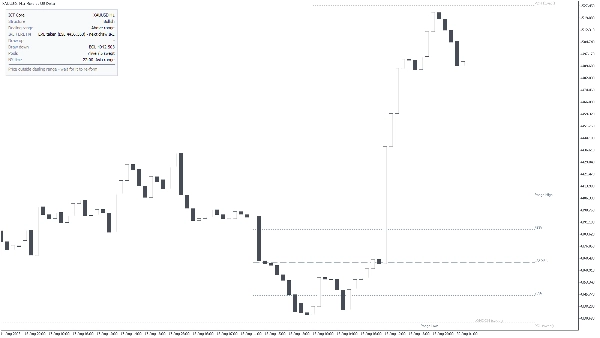
- Intervallo di negoziazione. L'intervallo attivo tra l'ultimo massimo e minimo valido, con quadranti opzionali al 25% / 75% per riferimento a premio / sconto.
- IRL / ERL. Il pannello indica se la liquidità esterna è stata presa e il prossimo disegno è interno, o viceversa, letto dal timeframe superiore selezionato.
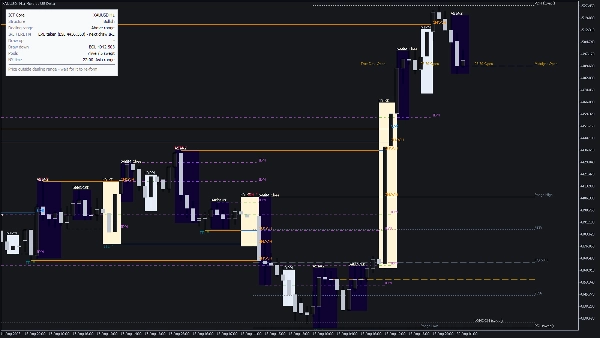
- Sessioni e tempo. Riquadri Asia, Londra, NY AM e NY PM; killzone di Londra, New York e chiusura Londra; finestre silver bullet; macro opzionali da 20 minuti; e linee di prezzo di apertura della sessione.
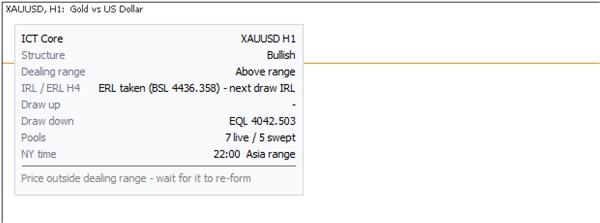
- Pannello informativo. Simbolo e timeframe, bias strutturale, posizione del prezzo nell'intervallo di negoziazione, stato IRL / ERL, il disegno più vicino sopra e sotto con il suo prezzo, quanti pool sono attivi rispetto a quelli sweepati, orario di New York e sessione attiva - più una riga di piano condizionale come "Prezzo fuori dall'intervallo di negoziazione - attendere che si riformi".
- Avvisi. Popup, suono o email su sweep di pool, su BOS / CHOCH, e all'apertura della killzone.
IMPOSTAZIONI CHIAVE
- Generale: tema del grafico (auto / chiaro / scuro), barre da analizzare (default 1500), dimensione del font delle etichette, e quanto distanziate sono le etichette (in ATR).
- Struttura di mercato: forza dello swing in barre per ogni lato (default 2), quali livelli di swing mostrare, BOS / CHOCH attivi o no, rotture solo con coda attive o no, induzione attiva o no, e dimensione dell'impulso in ATR che qualifica un massimo o minimo come forte (default 1.0).
- Pool di liquidità: quali pool disegnare, tolleranza massimi / minimi uguali in ATR (default 0.15), quanti giorni prima che un pool scada (default 20), e se i pool sweepati rimangono visibili.
- Intervallo di negoziazione: intervallo attivo o no, quadranti 25% / 75% attivi o no.
- IRL / ERL: timeframe sorgente (default H4) e quante barre scansionare (default 300).
- Sessioni: riquadri sessione, killzone, silver bullet, macro, prezzi di apertura, quanti giorni indietro disegnare (default 5), e opacità del riempimento del riquadro.
- Pannello: angolo, offset X / Y, dimensione del font, se mostrare la riga del piano, quante barre uno sweep conta ancora come recente (default 12), e se il piano richiede una killzone attiva.
- Avvisi e un set completo di colori per ogni elemento sul grafico.
USO TIPICO
1. Aggiungi ICT Core a un grafico M5 - H1 di XAUUSD, un indice o una coppia FX principale.
2. Leggi il pannello dall'alto verso il basso: bias, posizione nell'intervallo di negoziazione, IRL / ERL, e il disegno più vicino sopra e sotto.
3. Attendi che un pool di liquidità venga sweepato all'interno di una killzone, poi cerca CHOCH contro lo sweep sul tuo timeframe di ingresso.
4. Usa il disegno opposto mostrato nel pannello come obiettivo, e l'estremo sweepato come invalidazione.
5. Attiva gli avvisi di sweep e BOS / CHOCH se non vuoi guardare il grafico per tutta la sessione.
A CHI È RIVOLTO
Trader che già lavorano con ICT / Smart Money Concepts e vogliono avere i livelli di struttura, liquidità e timing su un unico grafico invece di disegnarli a mano ogni giorno. È rivolto a trader discrezionali intraday e a breve swing. Non è uno strumento per principianti con frecce di acquisto / vendita - devi sapere cosa significano BOS, CHOCH, IDM, IRL e ERL per usarlo.
LIMITAZIONI IMPORTANTI E NOTE D'USO
- ICT Core è uno strumento di analisi e visualizzazione. Non piazza ordini, non dà segnali di acquisto / vendita, e la riga del piano è un promemoria condizionale, non una raccomandazione.
- Tutto deriva da swing confermati, quindi un punto di struttura appare solo dopo che il numero richiesto di barre si è chiuso su ogni lato (default 2). Nulla viene ridisegnato successivamente.
- Gli orari di sessione e killzone seguono l'orario di New York inclusa l'ora legale. Il tuo grafico è mostrato in orario server del broker, quindi i riquadri non si allineeranno con un offset UTC fisso - questo è voluto.
- La lettura IRL / ERL del timeframe superiore necessita di abbastanza storia su quel timeframe; su simboli con storia breve viene mostrata come non disponibile.
- L'analisi è limitata alla finestra barre-da-analizzare (default 1500). Aumentala per più storia, a costo di un primo disegno più pesante.
- Funziona su cTrader Desktop per Windows e Mac. Indicatori personalizzati non sono disponibili su mobile o web.
- Il trading comporta rischi. Il comportamento passato di qualsiasi pattern non garantisce risultati futuri. Usa sempre la tua gestione del rischio.
Riepilogo
ICT Core highlights liquidity pools from previous days, weeks, months, and sessions, showing buy-side and sell-side levels, and dims swept pools to maintain historical context. It also delineates session times and killzones based on New York time with automatic daylight saving adjustments. An info panel provides a summary of current bias, price position within the dealing range, IRL/ERL status, nearest levels, live versus swept pools, and a conditional trading plan in plain English.
Users can customize settings including chart theme, swing parameters, liquidity pool visibility, session displays, and alert notifications for pool sweeps, BOS/CHOCH events, and killzone openings. ICT Core is intended for traders familiar with ICT/SMC concepts seeking an integrated, structured view of market dynamics for intraday and short-swing discretionary trading.











![Logo di "Smart Money Concepts (SMC) [Iridio Capital]"](https://cdn.ctrader.com/image/webp/b4b5414d-a5ca-44b7-a947-e28eca44a218_61548)





