![Trading product for [Hamster-Coder] Moving Average Gösterge, image 1](https://cdn.ctrader.com/image/webp/1bd952ad-57d2-4db2-9b49-b01be0b048b8_30113)
![Trading product for [Hamster-Coder] Moving Average Gösterge, image 2](https://cdn.ctrader.com/image/webp/5cbf2c4f-741d-4616-9911-6301ee158087_30114)
![Trading product for [Hamster-Coder] Moving Average Gösterge, image 3](https://cdn.ctrader.com/image/webp/6251be11-989e-4e5c-8c3e-1f055bb32247_30115)
Açıklama
📌 Mevcut Sürüm
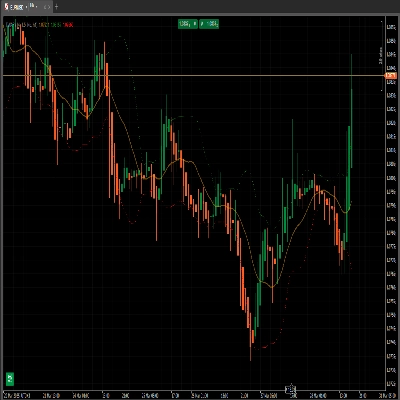
Grafikte gösterilen sürümün bu değerle eşleştiğinden emin olun:
Sürüm: 1.2.0
Sürüm Tarihi: 2025-08-03 18:00:00
🔧 Mevcut Sürümler
🔹 MTF Sürümü (Çoklu Zaman Dilimi) - [Hamster-Coder] Hareketli Ortalama MTF
MTF sürümü, göstergenin en güçlü varyantıdır.
Tam çoklu zaman dilimi desteği içerir, kullanıcıların herhangi bir özel zaman dilimini seçmelerine imkan tanır, grafik zaman diliminden bağımsız olarak hareketli ortalama hesaplaması için.
Daha yüksek zaman dilimi yapılarının tanımlanması için idealdir.
🔹 Standart Sürüm - [Hamster-Coder] Hareketli Ortalama
Standart sürüm, **[Hamster-Coder] Pivot Points MTF** özelliklerini içerir ancak çoklu zaman dilimi desteği seçimi yoktur.
📖 Açıklama
[Hamster-Coder] Pivot Points, Hamster-Coder™ Algo Serisi'nin esnek bir pivot noktası göstergesidir ve özelleştirilebilir bir yumuşatma algoritmasına dayalı dinamik bir seviye hesaplayan çok yönlü bir analiz aracıdır. Klasik hareketli ortalamaların geliştirilmiş hali olarak tasarlanmıştır ve bir trader’ın bireysel stratejisine daha iyi uyum sağlamak için esnek parametreler sunar.
🧠 Hamster-Coder™ Algo Serisi
Bu gösterge, her ana parametreye ayrı zaman dilimleri atamanıza olanak tanıyan Zaman Dilimi Ayrımı adlı özel bir konsepti uygulayan güçlü bir araç setinin parçasıdır.
Sonuç: tek bir grafikte gerçek çoklu zaman dilimi analizi — modern traderlar için oyunu değiştiren bir yetenek.
Bu seriden daha fazla göstergeyi keşfetmek için platformda “Hamster-Coder” araması yapabilirsiniz.
🚀 Temel Özellikler
- Zaman Dilimi Ayrımı (seri özelliği)
Hassas kontrol için temel (örneğin, hareketli ortalama) ve sapma kaynağı gibi bileşenlere bağımsız zaman dilimleri atayın. - Çoklu Zaman Dilimi Fiyat Girdileri
Herhangi bir mevcut zaman dilimindenAçılış,Kapanış,Yüksek,Düşük,HL2,HLC3,HLCC4veyaOHLC4seçin. - Gerçek Zamanlı Ayarlamalar
Gösterge uygulandıktan sonra parametreleri değiştirin — platformdaki varsayılan kaynak özellikleriyle mümkün olmayan bir şey. - Ayarlanabilir Hassasiyet
Kaç barın ortalamasının alınacağını kontrol edenUzunluk(Periyotlar) kullanarak pivot tespitini ince ayarlayın. - Sorunsuz Entegrasyon
Hem manuel ticaret hem de otomatik stratejilerle mükemmel çalışacak şekilde tasarlanmıştır.
🛠️ Nasıl Kullanılır
m1 grafikte 30m zaman dilimi Basit Hareketli Ortalama uzunluğu 50 görmek için:
1. 'm1' grafiğine uygulayın
2. 'm30' fiyat zaman dilimini seçin
3. ' Kapanış' fiyat kaynağını seçin
4. '1' fiyat ofsetini seçin (HTF > Grafik zaman dilimi için 0'dan büyük değerler kullanılması önerilir, çünkü aktif zaman diliminde her tikte yeniden hesaplama yapar)
5. ' Basit' hareketli ortalama türünü seçin 6. '50' hareketli ortalama uzunluğunu seçin
✅ Sürüm Kontrolü
Grafiğin sağ alt köşesinde mevcut sürümü göstermek için 'Sürümü Göster' = Evet olarak ayarlayın.
- Bu sürümün, bu açıklamanın en üstünde listelenen "Mevcut Sürüm" ile eşleştiğinden emin olun.
- Eğer uyumsuzluk varsa — destek ile iletişime geçin veya doğrudan geliştiriciye ulaşın.
🙋♂️ Not
İyi işlemler! Ve öneriler, özellik talepleri veya özel geliştirme ile ilgili sorular için yorum bırakmaktan çekinmeyin.
Özet
This indicator is suitable for intraday and medium-term trading, helping identify dynamic balance levels that serve as support or resistance zones independent of the chart timeframe. It is part of the Hamster-Coder™ Algo Series, which features Timeframe Decoupling—a proprietary concept enabling assignment of separate timeframes to key parameters for true multi-timeframe analysis on a single chart.
Key functionalities include real-time parameter adjustments, multi-timeframe price inputs, and seamless integration with manual and automated trading strategies. The product offers both a standard version and a Multi-Timeframe (MTF) version, the latter allowing users to select any custom timeframe for moving average calculation independent of the chart's timeframe, aiding in higher-timeframe structure identification.
!["[Hamster-Coder] Pivot Points (Demo)" logosu](https://cdn.ctrader.com/image/webp/87b54299-8c73-4942-9207-4bc6db824811_31153)
!["[Hamster-Coder] Pivot Points MTF" logosu](https://cdn.ctrader.com/image/webp/4c143e5a-309c-40e3-a578-f04d1e133ffa_31159)
!["[Hamster-Coder] Price" logosu](https://cdn.ctrader.com/image/webp/893fb641-d5b3-44d8-91fb-6a2dc6f3d309_30647)
!["[Hamster-Coder] Bollinger Bands" logosu](https://cdn.ctrader.com/image/webp/21d8e5d6-fb11-4bac-b9ee-cd05c2b76804_30327)
!["[Hamster-Coder] Moving Average MTF" logosu](https://cdn.ctrader.com/image/webp/b11b98b1-194d-4b8e-b00e-d611826ad159_31226)
!["[Hamster-Coder] Pivot Points" logosu](https://cdn.ctrader.com/image/webp/cdac5a8c-e5cf-40b7-9507-25d4cdfb1e29_31156)


!["[Stellar Strategies] Market Regime Filter" logosu](https://cdn.ctrader.com/image/webp/3bdeba11-7e8b-4e5f-9af9-d562f48df039_28423)