
Weis & Wyckoff System v2.0
อินดิเคเตอร์
2.39K ดาวน์โหลด
เวอร์ชัน 1.1, Jan 2026
Windows, Mac
5.0
รีวิว: 3
คำอธิบาย
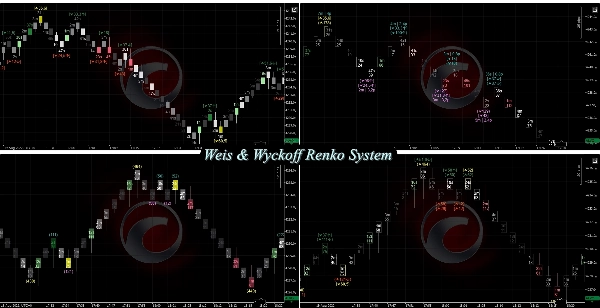
ระบบ Weis & Wyckoff ตอนนี้รองรับ แผนภูมิใดก็ได้! [Candles, Tick, Renko, Range, Heikin-Ash]
คำอธิบายล่าสุด -> 11/11/2025
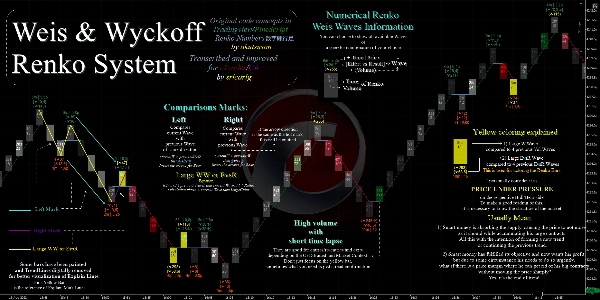
ระบบ Weis & Wyckoff แสดงแนวคิดของ David H. Weis และ Richard Wyckoff
มีอะไรใหม่ใน Revision 1?
- รองรับแผนภูมิ [Candles, Heikin-Ash, Tick, Range]
- ปรับปรุง ZigZag => รองรับ MTF + โหมด [ATR, Percentage, Pips, NoLag_HighLow]
- รวมการปรับปรุงที่เกี่ยวข้องกับ "Order Flow Aggregated" ทั้งหมด
-
- MA ที่กำหนดเอง
- การวาดภาพประสิทธิภาพ
- ตัวกรองความแข็งแกร่ง (MA/StdDev/ทั้งสอง)
- VP_Tick() ประสิทธิภาพสูง
- GetWicks() ประสิทธิภาพสูง
- การเก็บรวบรวมข้อมูล Tick แบบอะซิงโครนัส
- แก้ไข => แผงพารามิเตอร์บน MacOS
==========================
นี่เป็นเพียงวิธีการแสดงคลื่นและปริมาณเป็นตัวเลขเท่านั้น ไม่ใช่แนวคิดต้นฉบับ
คุณสามารถพบวิธีการแสดงผลนี้ครั้งแรกได้ที่:
- David Weis on Wyckoff | Support/Resistance | and Waves,
- Weis on Wyckoff Renko Charts - Linda Raschke (ล่าสุด)
สิ่งนี้ใช้แนวคิดโค้ดของ:
- (Numbers-Renko 数字練行足 ใน PineScript),
- ขอขอบคุณ akutsusho!.
ฉัน ปรับปรุงมัน และ นำมันมาใช้ กับ cTrader/C# และมันยังเป็นฟรี/โอเพ่นซอร์สด้วย
=========================================
ถอดความ & ปรับปรุงสำหรับ cTrader/C#
โดย srlcarlg
โค้ดต้นฉบับใน TradingView/Pinescript
โดย akutsusho
=========================================
ควรเลือกเวอร์ชันจากร้านค้า cTrader เสมอ เพราะจะได้รับการอัปเดตก่อน
ตัวชี้วัดทั้งหมด ที่ฉันพัฒนา เป็นโอเพ่นซอร์ส หากคุณไม่สามารถเข้าถึงโค้ดได้ ให้ตรวจสอบที่ ที่เก็บ Github
สรุป
สรุปโดย AI
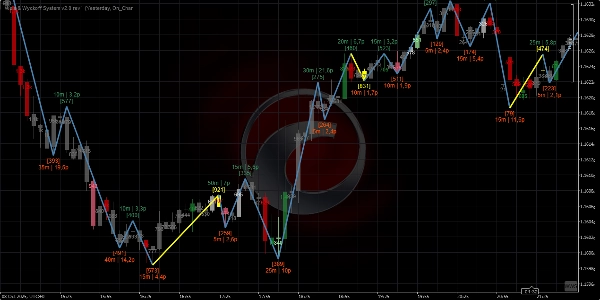
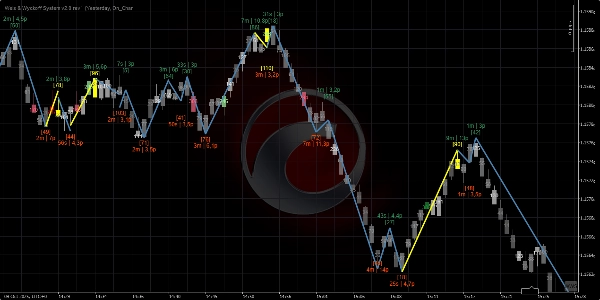
Weis & Wyckoff System v2.0 is an open-source trading indicator for the cTrader platform that visualizes market waves and volume based on the concepts of David H. Weis and Richard Wyckoff. It supports multiple chart types including Candles, Heikin-Ashi, Tick, Range, and Renko charts. The system numerically displays wave patterns and volume dynamics to assist in market analysis.
Key features include:
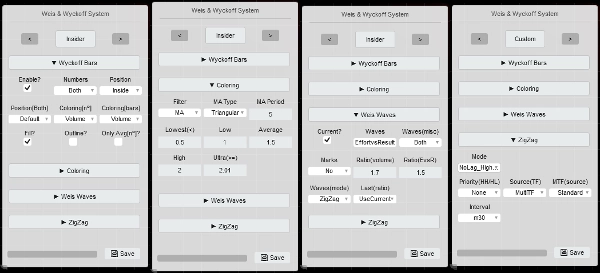
- A versatile Params Panel with four layout templates (Insider, Time, Volume, BigBrain) for quick and user-friendly customization.
- Enhanced ZigZag functionality with multi-timeframe support and multiple modes such as ATR, Percentage, Pips, and NoLag High/Low.
- Integration of order flow aggregation improvements, including custom moving averages, performance drawing, strength filters (MA, StdDev, or both), and high-performance tick volume and wick calculations.
- Dynamic TimeLapse feature showing time waves across various intervals from milliseconds to days.
- Compatibility with Mac OS and requires .NET 6.0 or higher.
The indicator is a C# adaptation and improvement of original PineScript concepts, designed to provide detailed wave and volume visualization without repainting options. It is maintained as open source, with code available on GitHub for transparency and further development.
Key features include:
- A versatile Params Panel with four layout templates (Insider, Time, Volume, BigBrain) for quick and user-friendly customization.
- Enhanced ZigZag functionality with multi-timeframe support and multiple modes such as ATR, Percentage, Pips, and NoLag High/Low.
- Integration of order flow aggregation improvements, including custom moving averages, performance drawing, strength filters (MA, StdDev, or both), and high-performance tick volume and wick calculations.
- Dynamic TimeLapse feature showing time waves across various intervals from milliseconds to days.
- Compatibility with Mac OS and requires .NET 6.0 or higher.
The indicator is a C# adaptation and improvement of original PineScript concepts, designed to provide detailed wave and volume visualization without repainting options. It is maintained as open source, with code available on GitHub for transparency and further development.
โปรไฟล์อินดิเคเตอร์
รีวิวจากลูกค้า
5.0
รีวิว: 3
5 | 100 % | |
4 | 0 % | |
3 | 0 % | |
2 | 0 % | |
1 | 0 % |
รีวิวจากลูกค้า
December 25, 2025
July 9, 2025
Pros: Visualizes wave structure and market phases using Renko and volume, following Wyckoff principles. Flexible settings, clear structure recognition. Cons: No tooltips or alerts. Requires Renko charts, less applicable on standard timeframes. Demands experience for interpretation.
May 13, 2025
its amazing indicator and thanks for coding this. Can you do this for range chart.
การสนทนา
คำถามที่พบบ่อย
ZigZag
VWAP
ผลิตภัณฑ์ที่มีให้บริการผ่าน cTrader Store รวมถึงบอทการเทรด อินดิเคเตอร์ และปลั๊กอิน มีให้บริการโดยนักพัฒนาบุคคลที่สามและมีไว้เพื่อวัตถุประสงค์ในการเข้าถึงข้อมูลและทางเทคนิคเท่านั้น cTrader Store ไม่ใช่โบรกเกอร์และไม่ได้ให้คำแนะนำการลงทุน คำแนะนำส่วนบุคคล หรือการรับประกันผลการดำเนินงานในอนาคต


ราคา
ตั้งแต่ 12/12/2024
1
การขาย
33.23K
ติดตั้งฟรี