
Descripción
El FullTrendReversalmoagi2 es un indicador personalizado de soporte y resistencia para cTrader, diseñado específicamente para ayudar a los traders a identificar zonas potenciales de reversión y continuaciones de tendencia con claridad y precisión.
🔹 Características principales:
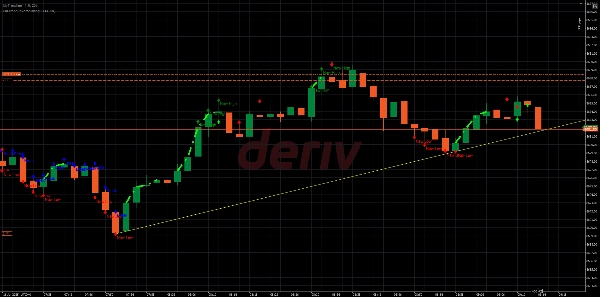
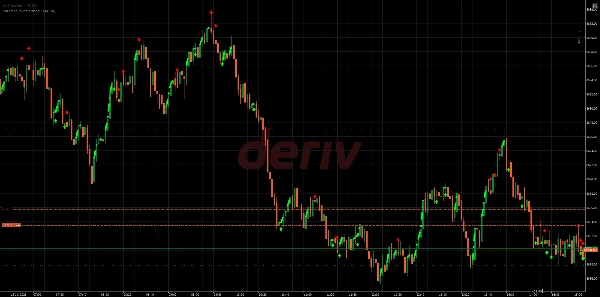
• Traza dinámicamente niveles de soporte y resistencia basados en la estructura reciente del mercado.
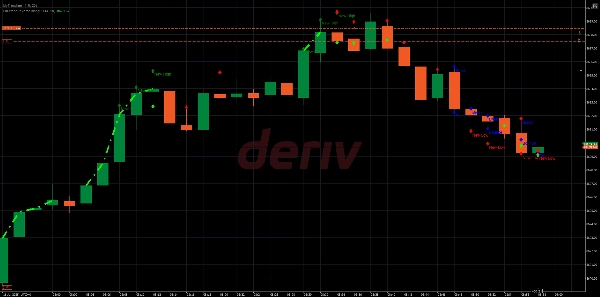
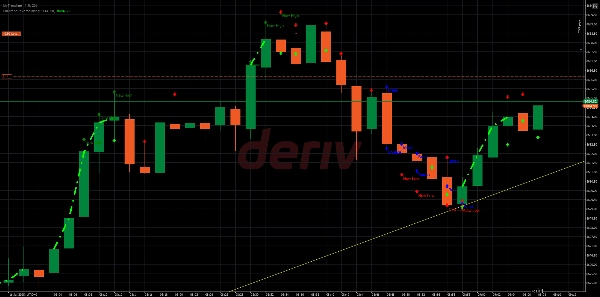
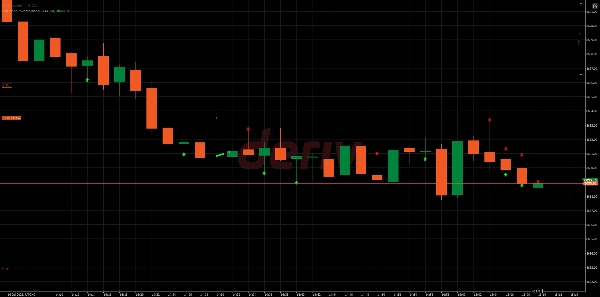
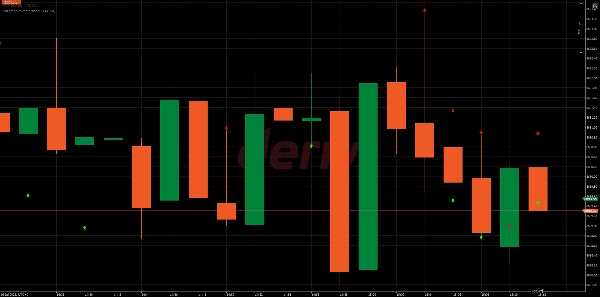
• Muestra flechas rojas que señalan zonas de resistencia bajista donde el precio puede revertir a la baja.
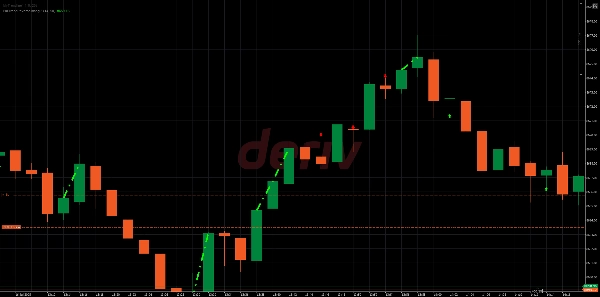
• Muestra flechas verdes que señalan zonas de soporte alcista donde el precio puede rebotar al alza.
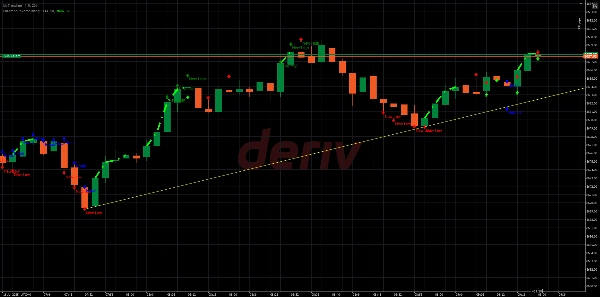
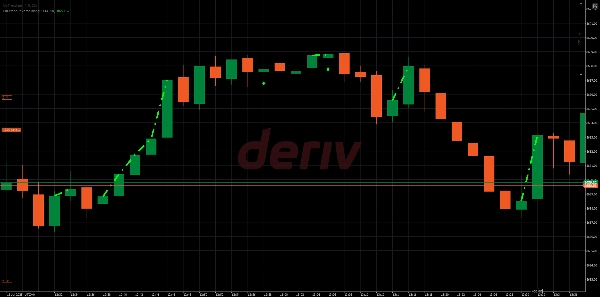
• Dibuja una línea de tendencia punteada verde para indicar fases activas de tendencia alcista.
• Marca máximos y mínimos nuevos en el gráfico para ayudar a visualizar el impulso del mercado en evolución.
🔹 Uso:
• Operar reversiones cuando el precio reacciona a las flechas rojas o verdes.
• Operar continuaciones usando la línea de tendencia punteada como confirmación de la tendencia predominante.
✨ Combina perfectamente con el MyTrendLine1 indicador, que detecta rebotes y rupturas de líneas de tendencia permitiendo a los traders confirmar reversiones o continuaciones en niveles críticos y reducir señales falsas.


