Description
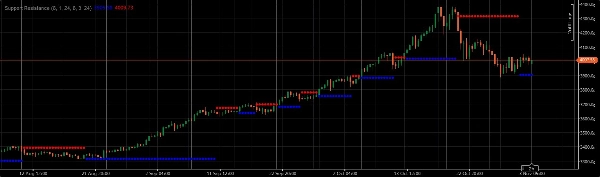
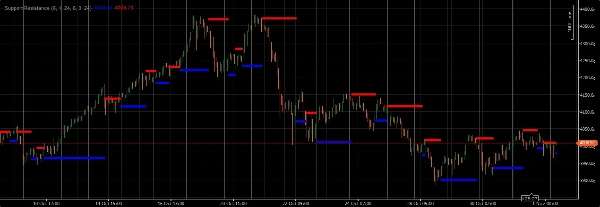
Lors du trading de l'or, utilisez les niveaux de support et de résistance sur différentes périodes (graphiques larges, en plage et en ticks) pour identifier les cassures potentielles de pivot ou les points de support/résistance. Confirmez toujours ces signaux avec d'autres indicateurs techniques tels que les moyennes mobiles, les oscillateurs et les figures en chandeliers pour des trades à probabilité plus élevée
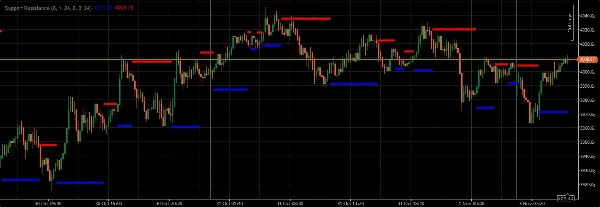
Lors du trading de l'or, utilisez les niveaux de support et de résistance sur différentes périodes (graphiques larges, en plage et en ticks) pour identifier les cassures potentielles de pivot ou les points de support/résistance. Lors du trading de l'or, utilisez les niveaux de support et de résistance sur différentes périodes (graphiques larges, en plage et en ticks) pour identifier les cassures potentielles de pivot ou les points de support/résistance. Ces niveaux, une fois identifiés, peuvent servir de points de décision cruciaux. Une cassure au-dessus de la résistance ou en dessous du support, surtout lorsqu'elle est accompagnée d'une augmentation de la taille du corps de la bougie, signale souvent une continuation de la tendance ou un changement significatif du sentiment du marché. À l'inverse, un rebond sur un niveau de support ou un rejet à la résistance peut indiquer un retournement potentiel ou une continuation de la consolidation actuelle. Confirmez toujours ces signaux avec d'autres indicateurs techniques tels que les moyennes mobiles, les oscillateurs et les figures en chandeliers pour des trades à probabilité plus élevée. De plus, prêtez une attention particulière aux événements d'actualité et aux publications de données économiques, car ceux-ci peuvent avoir un impact considérable sur les prix de l'or et invalider des configurations purement techniques. La gestion des risques est primordiale ; ne risquez jamais plus qu'un petit pourcentage de votre capital de trading sur une seule opération.
Résumé
Avis clients
5 | 100 % | |
4 | 0 % | |
3 | 0 % | |
2 | 0 % | |
1 | 0 % |


![Logo de "[Stellar Strategies] Smart ADX"](https://cdn.ctrader.com/image/webp/af13b084-b6f6-41db-b7bc-c7e688b57b05_36929)


