Description
PROPFOLIO MASTER SUITE : MANUEL D'INSTRUCTIONS
Plateforme : cTrader Version : 1.0 (Édition conforme au Store) Propulsé par : Propfolio Solutions
Bienvenue dans le Tableau de bord PropFolio Peak Formation SMC. Il s'agit d'une suite complète de graphiques institutionnels conçue pour réunir les Smart Money Concepts (SMC), le suivi Beat The Market Maker (BTMM) et l'analyse du Volume Profile en un seul indicateur cTrader léger et hautement optimisé.
📥 1. GUIDE D'INSTALLATION
- Téléchargez le fichier
PropFolioPeakFormationSMCDashbaord.algo. - Double-cliquez sur le fichier
.algo. cTrader s'ouvrira automatiquement et l'installera. - Ouvrez n'importe quel graphique dans cTrader.
- Cliquez droit sur le graphique -> Indicateurs -> Personnalisés -> Sélectionnez PropFolioPeakFormationSMCDashbaord.
- Cliquez sur OK pour appliquer.
📊 2. EXPLICATION DU TABLEAU DE BORD
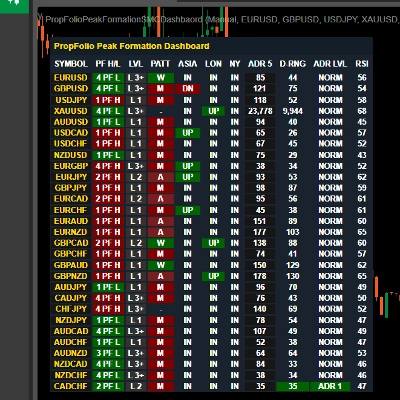
La suite propose un tableau de bord multi-symboles qui suit en temps réel les états institutionnels du marché à travers 11 colonnes.
- SYMBOLE : La paire de devises suivie. Vous pouvez définir une liste personnalisée dans les paramètres de l'indicateur.
- PF H/L (Formation de Pic) : Indique si le cycle actuel de 5 jours est en Formation de Pic Haut (PFH) ou Formation de Pic Bas (PFL), et depuis combien de jours il s'est formé.
- LVL (Niveau) : Le niveau actuel du cycle BTMM (Niveau 1, Niveau 2 ou Niveau 3+).
- PATT (Motif) : Identifie les motifs institutionnels intra-journaliers.
-
- M / W : Formations standard en M et W.
- A / V : Sommets en A et creux en V.
- ASIE / LON / NY : Montre l'état actuel du prix par rapport à la plage de cette session spécifique.
-
- HAUT (Vert) : Le prix a dépassé le plus haut de la session.
- BAS (Rouge) : Le prix est descendu en dessous du plus bas de la session.
- DANS (Gris) : Le prix évolue à l'intérieur de la boîte de la session.
- ADR 5 : La plage moyenne quotidienne sur les 5 derniers jours (en pips).
- D-RNG : La plage actuelle de la journée (en pips).
- NIVEAU ADR : Indique si la journée en cours a épuisé son ADR.
-
- NORM : Plage normale.
- ADR 1 / 2 / 3 : Le prix a dépassé 1x, 2x ou 3x son volume quotidien normal (attendez-vous à une exhaustion/inversion).
- RSI : RSI sur 15 minutes pour détecter rapidement les conditions de surachat (Rouge) ou de survente (Vert).
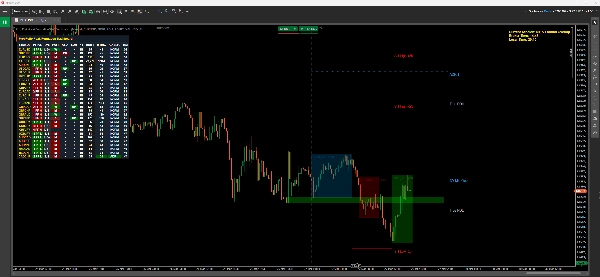
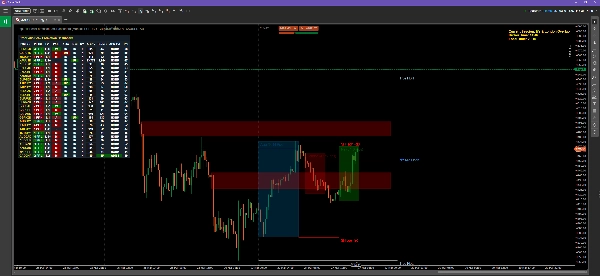
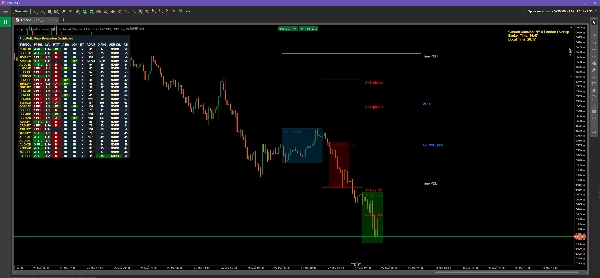
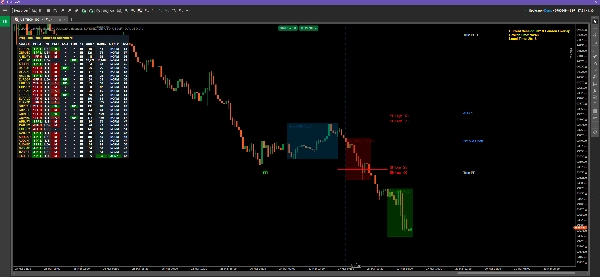
👁️ 3. VISUELS DU GRAPHIQUE & OUTILS SMC
1. Killzones (Boîtes de Liquidité) L'indicateur trace automatiquement des boîtes transparentes pour les sessions Asiatique, Londres et New York. La taille en pips de chaque boîte est indiquée en bas.
2. Lignes de Chasse aux Stops (BTMM) Des lignes sont tracées 25 et 50 pips au-dessus et en dessous de la boîte de la session asiatique. Ce sont des cibles institutionnelles où les market makers chassent les stops des traders particuliers avant d'inverser la tendance.
3. Vrai PDH & PDL Des lignes argentées marquent le Vrai Plus Haut du Jour Précédent et le Plus Bas du Jour Précédent, calculés strictement de l'ouverture asiatique réelle à la clôture réelle de New York (ignorant le volume mort de rollover).
4. Offre & Demande (O&D) Le moteur analyse les 150 dernières bougies pour détecter les déséquilibres institutionnels.
- Boîtes Rouges : Offre non atténuée (zones de vente).
- Boîtes Vertes : Demande non atténuée (zones d'achat).
- Note : Les zones disparaissent une fois que le prix les a complètement atténuées (testées).
5. Lignes Cibles ADR Basées sur la Formation de Pic, l'indicateur projette des lignes en pointillés orange ou bleues marquant les cibles d'épuisement 1x, 2x et 3x de la plage moyenne quotidienne pour la journée.
📈 4. PROFIL DE VOLUME (Flexible vs. Fixe)
L'indicateur intègre un moteur de Profil de Volume complet pour trouver le Point de Contrôle (POC) et la Zone de Valeur Haute/Basse (VAH/VAL).
Comment utiliser le mode FLEXIBLE :
- Dans les paramètres de l'indicateur, assurez-vous que le Mode VP est réglé sur
Flexible. - Deux lignes verticales en pointillés de couleur aqua apparaîtront sur votre graphique.
- Il suffit de cliquer et de faire glisser ces lignes pour délimiter toute action de prix sur votre graphique.
- L'histogramme du Profil de Volume, le POC et la Zone de Valeur seront instantanément calculés et s'ajusteront précisément à la zone entre vos deux lignes !
Comment utiliser le mode FIXE : Réglez le mode sur FixedDaily. Le profil calculera automatiquement le volume pour la journée de trading en cours sans nécessiter de lignes déplaçables.
⚙️ 5. HUD TEMPS & ALERTES
HUD Temps Avancé Dans le coin supérieur droit, vous verrez un affichage texte doré. Cela calcule automatiquement l'heure de votre broker, l'heure locale de votre ordinateur, et vous indique exactement quelle session de trading est actuellement active (par exemple, "Chevauchement NY & Londres").
Alertes Terminal Lorsqu'une nouvelle Formation de Pic se produit, une notification sera imprimée directement dans votre onglet cTrader Automate -> Log afin que vous ne manquiez jamais une configuration. Note : Pour des notifications push externes avancées, veuillez visiter notre profil développeur Propfolio Solutions pour en savoir plus sur la suite étendue.
Résumé
Avis clients
5 | 100 % | |
4 | 0 % | |
3 | 0 % | |
2 | 0 % | |
1 | 0 % |