Mô tả
MTC Akademika Harmonics
Cấu trúc thị trường hài hòa, được đọc qua lăng kính của *Monadology* của Leibniz — trong cách diễn giải cá nhân của David Murawski, der Mustermann.
Mô tả ngắn gọn
MTC Akademika Harmonics là một lớp phủ biểu đồ được xây dựng trên một niềm tin duy nhất: giá không phải là tiếng ồn, mà là một tổng thể các phản chiếu. Được thành lập dựa trên các nguyên tắc của *Monadology* của Gottfried Wilhelm Leibniz — trong cách diễn giải cá nhân kéo dài nhiều năm của David Murawski, der Mustermann — nó tiết lộ nơi cấu trúc hài hòa của thị trường đồng thuận trên mọi quy mô, và cô đọng cách đọc đó thành một bảng điều khiển chuyên nghiệp, yên tĩnh. Đây là một công cụ phân tích và trực quan hóa tùy ý, không phải là hệ thống tự động hay dịch vụ tín hiệu.
Ý tưởng
Năm 1714, Leibniz đề xuất rằng thực tại được cấu thành từ các đơn vị đơn giản, không thể chia nhỏ — *monads* — mỗi đơn vị phản chiếu toàn bộ vũ trụ từ góc nhìn riêng của nó, và trật tự mà chúng ta trải nghiệm phát sinh từ một *hài hòa tiền định* giữa chúng. Ông cho rằng không có gì tồn tại mà không có *lý do đủ* của nó.
Chỉ báo này áp dụng thế giới quan đó vào biểu đồ. Mọi cấu trúc, từ dao động nhỏ nhất đến chuyển động lớn nhất, đều được xem như một phản chiếu của cùng một tổng thể — phần chứa trong tổng thể, tổng thể vang vọng trong phần. Ý nghĩa không được lấy từ bất kỳ tín hiệu đơn lẻ nào; nó xuất hiện trong những khoảnh khắc các phản chiếu độc lập hòa hợp với nhau. Và không có điểm quay nào là tùy tiện — mỗi điểm mang lý do của nó trong cấu trúc đã tạo ra nó.
Nó không phải là một bộ quét mẫu chung. Đây là sự chắt lọc của một tác giả về một ý tưởng ba trăm năm tuổi thành một công cụ giúp bạn quan sát.
Những gì bạn nhận được:
- **Một cách đọc mạch lạc trên mọi quy mô** — dao động nhỏ nhất và chuyển động lớn nhất trên một biểu đồ duy nhất, để bạn thấy cấu trúc thay vì sự lộn xộn.
- **Những khoảnh khắc hài hòa, được đánh dấu cho bạn** — những tình huống hiếm hoi khi các phản chiếu độc lập đồng thuận được làm nổi bật, để bối cảnh mạnh nhất tự nổi bật.
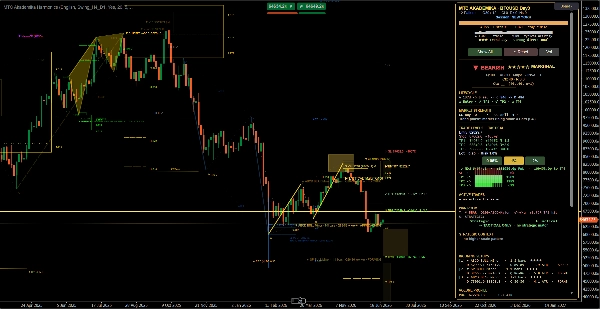
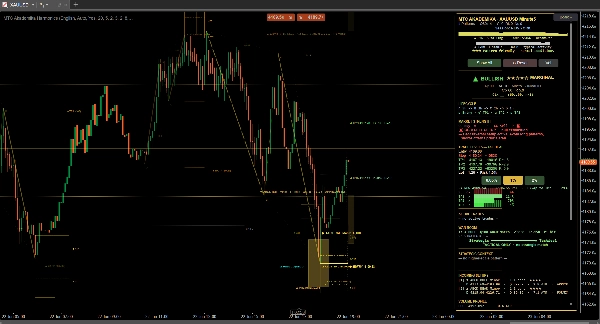
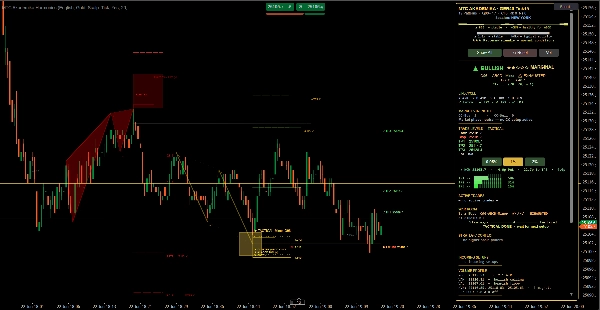
- **Các thiết lập hoàn chỉnh, dễ đọc** — cho mỗi cấu trúc: một vùng rõ ràng, các mục tiêu dự kiến và điểm dừng bảo vệ, với tỷ lệ thưởng-rủi ro được hiển thị ngay lập tức.
- **Bảng điều khiển chuyên nghiệp (Phòng Chiến / Giao diện Hiện đại)** — hướng đi, niềm tin, bối cảnh thị trường và hình ảnh đa khung thời gian, được cô đọng trong một bảng điều khiển.
- **Vòng đời trong nháy mắt** — mỗi cấu trúc được gắn nhãn *live*, *spent* hoặc *invalid*, để bạn luôn biết cái nào còn xứng đáng chú ý và cái nào nên bỏ qua.
- **Chế độ xem rủi ro tích hợp** — kích thước vị thế dựa trên kích thước tài khoản và rủi ro trên mỗi giao dịch, hiển thị bằng đơn vị tiền tệ tài khoản của bạn.
- **Nhận thức và cảnh báo đa khung thời gian** — cách đọc khung thời gian cao hơn, cùng với cảnh báo tùy chọn cho các cấu trúc mới và các điểm chạm quan trọng.
- **Hướng dẫn sử dụng bằng bảy ngôn ngữ** — dạy bạn triết lý và bảng điều khiển trong khi bạn sử dụng chúng.
Dành cho ai
Các nhà giao dịch tùy ý, những người suy nghĩ theo cấu trúc thay vì chỉ dựa vào chỉ báo; những người muốn một bức tranh yên tĩnh, thống nhất thay vì một bức tường cảnh báo; và những người đánh giá cao rằng các công cụ tinh tế nhất giấu đi cơ chế của chúng và chỉ hiển thị những gì quan trọng.
Về phương pháp
Cách đo hài hòa, cách các quy mô liên quan, cách hình thành cách đọc — đây là kết quả của nghiên cứu riêng lâu dài và theo thiết kế, không được tiết lộ. Bạn đang nhận được sự phán đoán, không phải công thức.
Tương thích
Chạy như một lớp phủ biểu đồ trên **bất kỳ ký hiệu và khung thời gian nào** (bao gồm cả biểu đồ tick). Giao diện bằng tiếng Anh, Đức, Tây Ban Nha, Ý, Pháp, Nga và Bồ Đào Nha.
Rủi ro
MTC Akademika Harmonics là một công cụ phân tích và trực quan hóa tùy ý, không phải là hệ thống giao dịch tự động hay dịch vụ tín hiệu. Nó làm nổi bật cấu trúc và bối cảnh; quyết định giao dịch và quản lý rủi ro hoàn toàn thuộc về bạn. Giao dịch có rủi ro thua lỗ. Kết quả trong quá khứ không đảm bảo kết quả trong tương lai.