present
Registrieren Sie sich und erhalten Sie $50 Rabatt auf Ihren ersten Kauf
Trading product for Hurst Cycle Panel Indikator Key Levels Market Structure, image 1
Hurst Cycle Panel
Indikator
Version 1.0, Jun 2026
Windows, Mac
Trading product for Hurst Cycle Panel Indikator Key Levels Market Structure, image 2
Trading product for Hurst Cycle Panel Indikator Key Levels Market Structure, image 3
Trading product for Hurst Cycle Panel Indikator Key Levels Market Structure, image 4
Seit 21/07/2025
1
Verkäufe

Beschreibung

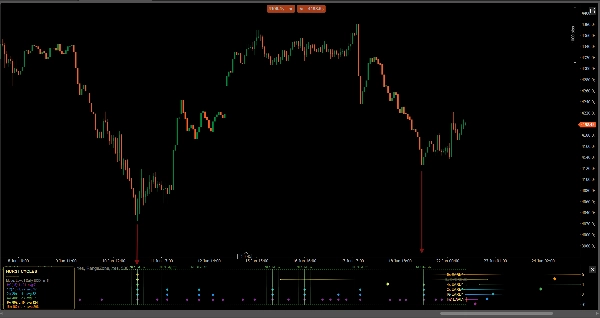
MTC Hurst Cycle Akademica bildet die zyklische Struktur jedes Marktes, Ebene für Ebene, in einem eigenen Unterfenster ab. Basierend auf dem zyklischen Marktmodell von J. M. Hurst markiert es die bestätigten Zyklustiefs (und optional Hochs) jeder aktivierten Zyklusebene als farbcodierte Diamanten, projiziert den Zeitpunkt des nächsten erwarteten Zyklustiefs und hebt das "Nest der Tiefs" hervor – Bars, bei denen mehrere Zyklustiefs zusammenfallen sollen, Hurst's klassischer Kontext mit hoher Wahrscheinlichkeit für Wendepunkte.

HAUPTMERKMALE

• 7 verschachtelte Zyklusebenen (HC, 1C, 2x, 4x, 8x, 16x, 32x) — beliebige Kombinationen aktivierbar.

• Nur bestätigte Diamanten — die neuesten Marker werden auf der Live-Kerze NICHT neu gezeichnet.

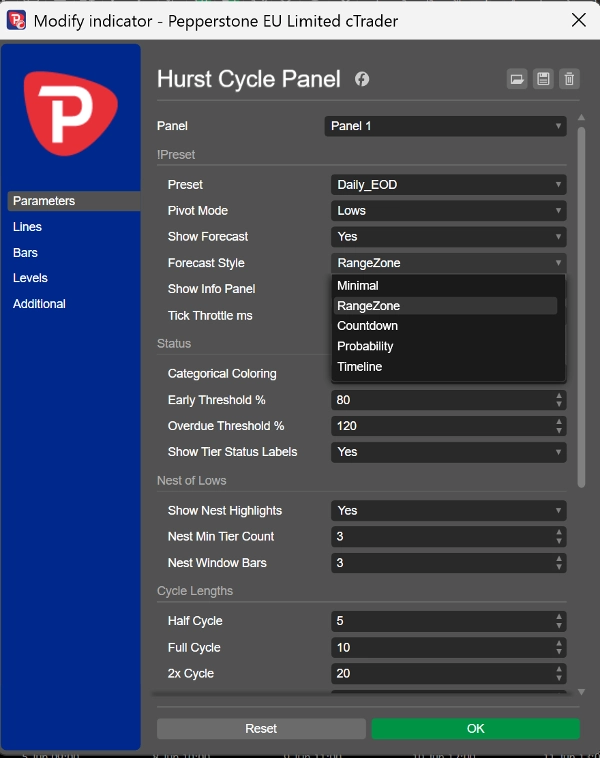
• Prognose des nächsten Tiefs in 5 Anzeigearten: Minimal, Bereichszone, Countdown, Wahrscheinlichkeit (1σ / 2σ), Zeitachse.

• Hervorhebung des "Nest der Tiefs", automatisch skaliert auf die aktivierten Zykluslängen.

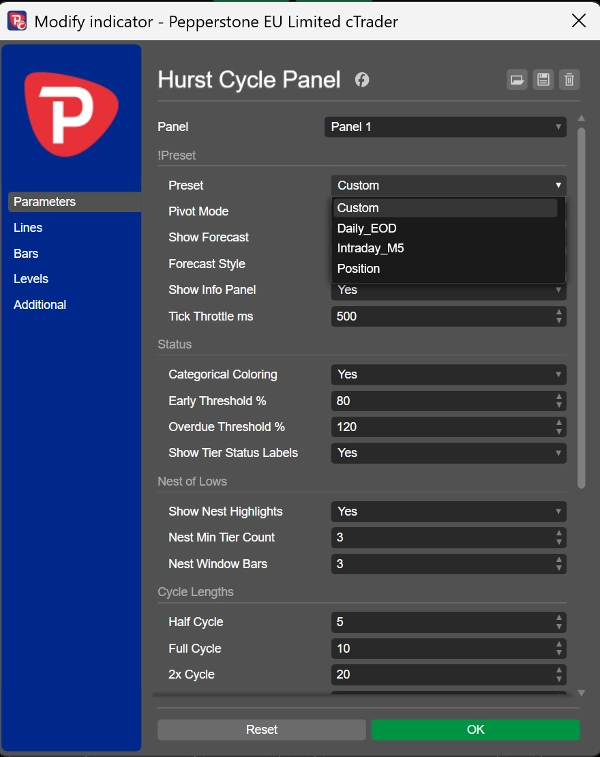
• Ein-Klick-Voreinstellungen: Tägliches EOD, Intraday M5, Position — oder vollständig benutzerdefinierte Zykluslängen.

• Modernes Informationspanel auf dem Chart: Pivot-Zählungen pro Ebene, gemessene durchschnittliche Zykluslänge (nur angezeigt, wenn statistisch aussagekräftig) und eine Harmonisches-Verhältnis-Prüfung.

• Pivot-Modus: Tiefs, Hochs oder Beide.

• Automatisch anpassbare Skala, saubere und flimmerfreie Darstellung.

ANWENDUNG

Fügen Sie es unter Ihrem Kurschart hinzu. Lesen Sie die niedrigsten Diamanten und die "Nest"-Hervorhebung als zyklischen Zeitrückgrat des Marktes und nutzen Sie die Prognose, um das Zeitfenster der nächsten Wendung abzuschätzen. Es passt natürlich zu MTC Hurst FLD Akademica (Preisniveaus) und MTC Hurst Pulse Akademica (Zyklusreife-Oszillator).

FUNKTIONIERT AUF

Jedes Symbol und jeden Zeitrahmen.

HAFTUNGSAUSSCHLUSS

Dies ist ein Werkzeug für technische Analyse und Visualisierung basierend auf der zyklischen Markttheorie von J. M. Hurst. Es platziert keine Aufträge und gibt keine Leistungs-, Genauigkeits- oder Gewinnversprechen. Zyklusanalyse ist probabilistisch und Vorwärtsprojektionen sind Schätzungen, keine Vorhersagen. Wenden Sie stets Ihr eigenes Risikomanagement und Urteilsvermögen an. Vergangenes Marktverhalten garantiert keine zukünftigen Ergebnisse.

Zusammenfassung

KI-Zusammenfassung
The Hurst Cycle Panel is a technical analysis indicator that visualizes the cyclic structure of any market across multiple nested cycle tiers within a dedicated sub-pane below the price chart. Based on J. M. Hurst's cyclic market theory, it identifies and marks confirmed cycle troughs and optionally crests as color-coded diamonds, which do not repaint on the live bar. The indicator forecasts the timing of the next expected cycle low using five display styles: Minimal, Range Zone, Countdown, Probability (1σ / 2σ), and Timeline. It also highlights "Nest of Lows," bars where multiple cycle lows coincide, indicating high-probability turning points.

Key features include seven nested cycle tiers (HC, 1C, 2x, 4x, 8x, 16x, 32x) with customizable combinations, one-click presets for common timeframes (Daily EOD, Intraday M5, Position), and a modern on-chart info panel showing pivot counts, average cycle length, and harmonic-ratio checks. Users can select pivot modes (Lows, Highs, or Both) and benefit from auto-fitting scale and flicker-free rendering.

The panel works on any symbol and timeframe and is intended as a visualization tool to aid cycle timing analysis. It complements other Hurst-based tools for price levels and cycle maturity oscillation.

Indikatorprofil
Indikatorkategorie
Momentum
Ausgabetyp
Visualisierung
Filter
Signale
Datenanforderungen
Nur Balken
Tick-Daten
Unterstützte Signale
Wendepunkt

Kundenbewertungen

0.0
Bewertungen: 0
Kundenbewertungen
Bisher gibt es keine Bewertungen für dieses Produkt. Haben Sie es schon ausprobiert? Dann können Sie die erste Person sein, die andere darüber informiert!

Diskussion

Häufig gestellte Fragen (FAQ)

Key Levels
Market Structure
Über den cTrader Store verfügbare Produkte, einschließlich Handelsbots, Indikatoren und Plugins, werden von externen Entwicklern bereitgestellt und nur zu Informations- und technischen Zugriffszwecken verfügbar gemacht. cTrader Store ist kein Broker und erbringt keine Anlageberatung, persönlichen Empfehlungen oder eine Garantie für zukünftige Performance.

Mehr von diesem Autor

Indikator
ATR
EMA
+2
Dense EMA rainbow + Pro tools & a tested engine — get more from your EMAs, your research base for EMA bots.
Indikator
Fibonacci
Key Levels
+1
Draw & learn Elliott, Harmonic, NeoWave manual plotting with built-in rule validator & coach.
Indikator
Fibonacci
Key Levels
+4
Harmonic market structure across every scale, via Leibniz's Monadology — by David Murawski, der Mustermann.

Das könnte Sie auch noch interessieren

„ATR Bands“-Logo
Beliebt
4.7
(4)
$19
Indikator
ATR
Prop
+13
Enhance trading with ATR Bands! Visualize market volatility using dynamic upper and lower ATR bands for precise decision
Indikator
Forex
Crypto
+6
The cTrader Chaos Reversals indicator brings high-quality reversal signals to traders.
Indikator
Prop
Forex
+9
Average Cost Price helps you keep track of your open positions on the chart. In doing so, it provides lines and explanat
Indikator
Prop
Forex
+11
🌊 See when the market is truly in play. Tsunami measures Relative Volume by time-of-day 🌊
Indikator
ATR
RSI
+6
Market structural patterns , specifically the concepts of Change of Character (ChoCH) 🔄 and Break of Structure (BoS) 💥
„Candlehtf“-Logo
Beste Ratings
4.2
(4)
$19
/
$20
Indikator
SMC
Forex
+13
MultiFrameCandles para cTrader: La Herramienta Definitiva para Dominar Cualquier Marco de Tiempo
Indikator
Volume
Key Levels
+2
Support and resistance from a rolling volume profile, ranked by strength or recency, updated live.
Indikator
BOS
Key Levels
+1
Guided by Yahuah Yahusha. 15M: BOS above red (buys)/below green (sells). 4HC reject+BOS. 5M: RBS/SBR. SL wick. TP 1:4.
Indikator
ATR
RSI
+5
Advanced Anchored VWAP for cTrader: volatility bands, real‑time alerts & customizable session resets.
Indikator
Forex
BTCUSD
+10
Enhance trading with TSI! Use the True Strength Index for clear insights into market momentum and trend strength.
Indikator
Supertrend
Adaptive MA anchored to structural trend changes — no fixed period. Dual Supertrend + swing detection.
Indikator
AI
Forex
+5
Dynamic, color‑coded candles reveal market shifts instantly—spot momentum and trend reversals at a glance
Indikator
AI
Prop
+7
EMA Clouds, Multi-Timeframe (MTF) Overlay, Swing High/Low detection, and a smart Dashboard with neutral zone filtering.
Indikator
Pin Bar
Inside Bar
+2
Advanced candlestick pattern recognition with structural quality scoring, alerts and adaptive chart visuals.
Indikator
AI
ATR
+20
Algorithmic trend precision for cTrader.
Indikator
Volume
Channel
+5
Spots volatility squeezes before they fire — the compression phase everyone else misses.
Indikator
RSI
Breakout
+1
Dynamically adjusts regression channels based on ZigZag extremes, resetting when price breaks bands to track real trends
Indikator
Key Levels
Market Structure
+1
HTF Candle Projector displays the current Higher Timeframe candle (4H or 1H) as a real projected candle LIVE..

Preis

Seit 21/07/2025
1
Verkäufe