
Ichimoku Kinko Hyo
Indikator
155 unduhan
Versi 1.0, Jul 2025
Windows, Mac
5.0
Ulasan: 1
Deskripsi
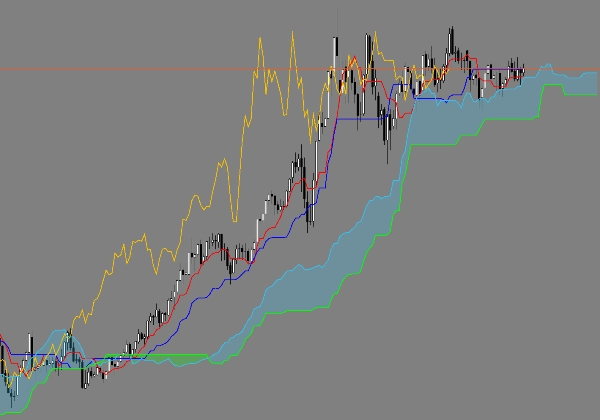
Ini adalah indikator Ichimoku Kinkō Hyō yang diperbaiki untuk cTrader. Secara default, displacement cTrader adalah 26 dan mulai menghitung dari nol, yang menyebabkan Chikou Span dan Kumo (awan) bergeser secara tidak benar. Versi ini memperbaikinya dengan menggunakan pergeseran 25-periode tetap untuk baik Chikou Span (dipindahkan 25 periode ke belakang) dan garis Kumo (dipindahkan 25 periode ke depan), sesuai dengan spesifikasi asli Jepang dan platform seperti TradingView. Ini memastikan semua garis Ichimoku dihitung dan dipetakan pada posisi yang benar untuk sinyal dan analisis yang akurat.
Ringkasan
Ringkasan AI
This product is a corrected Ichimoku Kinkō Hyō indicator designed for the cTrader platform. It addresses an issue in cTrader’s default Ichimoku implementation, where the displacement is set to 26 and counted from zero, causing misalignment of the Chikou Span and Kumo (cloud) lines. This version applies a fixed 25-period shift: the Chikou Span is moved 25 periods backward, and the Kumo lines are shifted 25 periods forward. This adjustment aligns the indicator’s calculations and plotting with the original Japanese Ichimoku specification and other platforms like TradingView. The correction ensures that all Ichimoku lines are displayed in their proper positions, supporting accurate technical analysis and signal interpretation.
Profil indikator
Ulasan pelanggan
5.0
Ulasan: 1
5 | 100 % | |
4 | 0 % | |
3 | 0 % | |
2 | 0 % | |
1 | 0 % |
Diskusi
Pertanyaan umum
Produk-produk yang tersedia melalui cTrader Store, termasuk bot trading, indikator, dan plugin, disediakan oleh pengembang pihak ketiga serta hanya ditujukan untuk akses teknis dan informasi. cTrader Store bukan broker dan tidak menyediakan saran investasi, rekomendasi pribadi, atau jaminan apa pun tentang kinerja di masa mendatang.


Harga
Sejak 20/03/2025
155
Instal gratis