


Liquidity Heatmap - Professional Multi-Timeframe Pivot Analysis
Transform your trading with advanced liquidity visualization. This powerful indicator reveals institutional liquidity zones by analyzing pivot points across 10 different timeframes simultaneously, creating a dynamic heatmap that shows exactly where smart money is likely positioned.
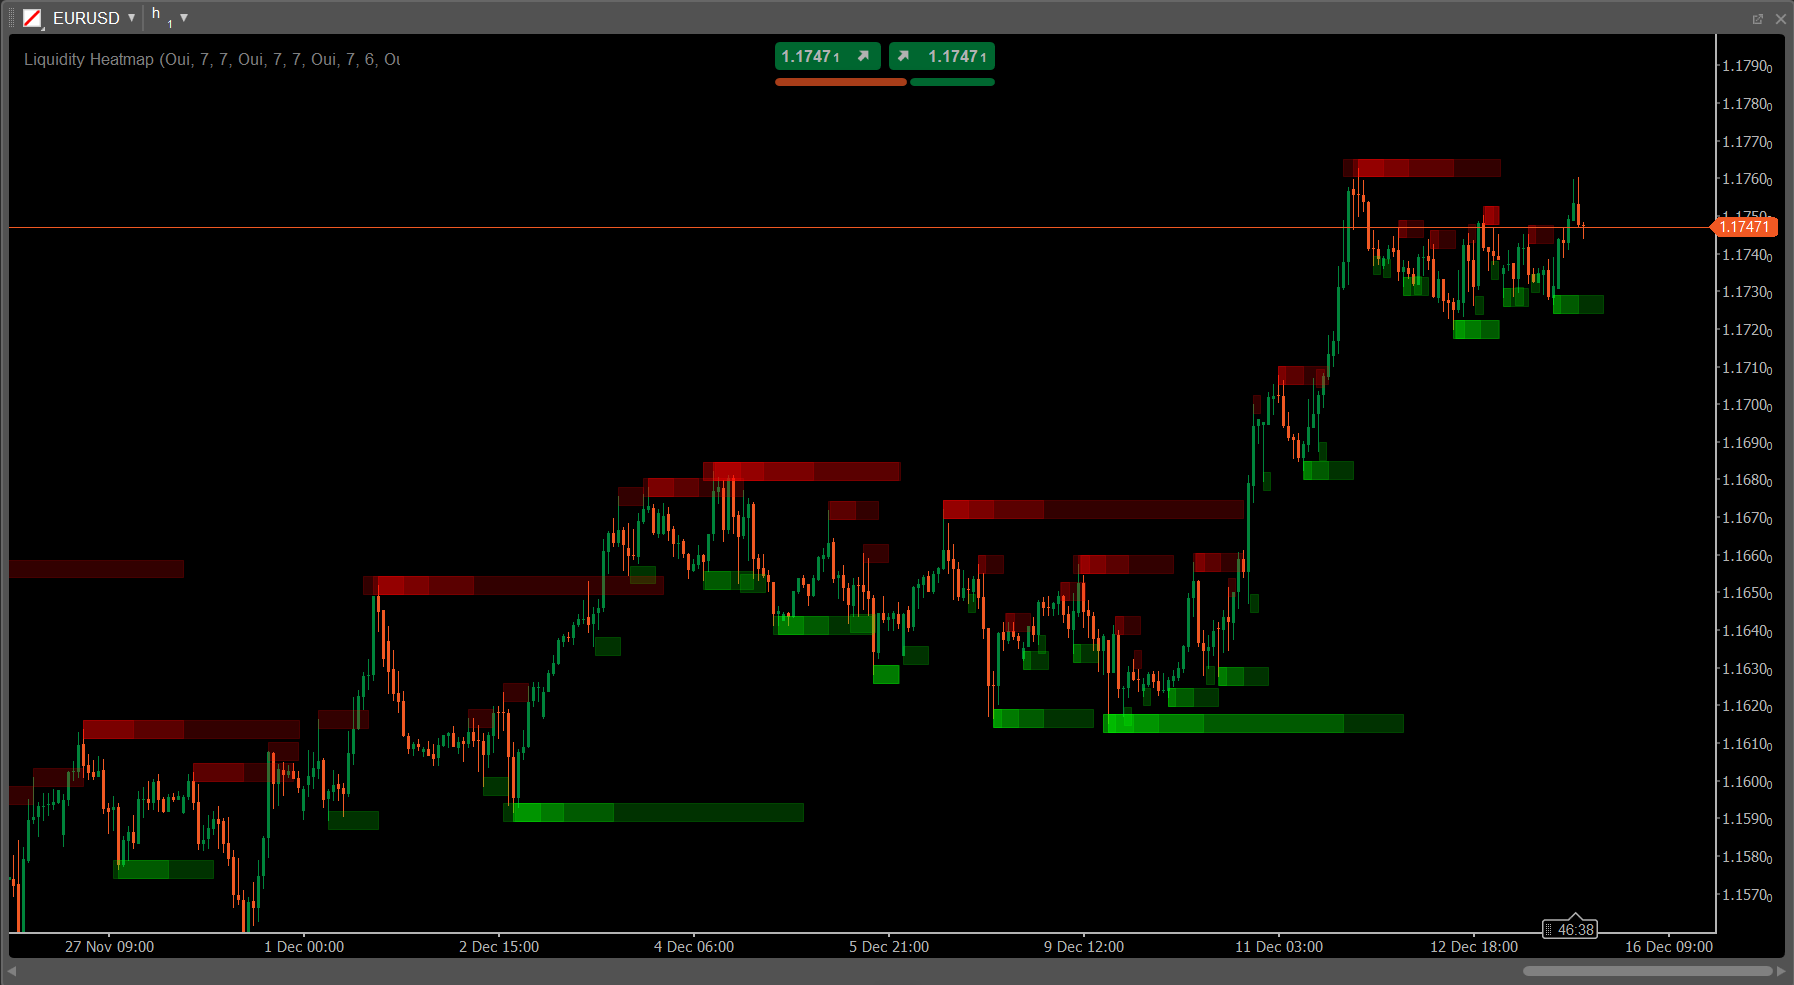
How It Works
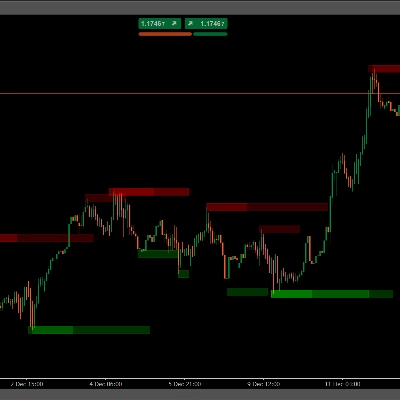
The indicator detects pivot highs and lows on multiple timeframes (15min, 30min, 1H, 2H, 4H, Daily, 8H, 3D, Weekly, Monthly) and overlays semi-transparent zones at each pivot level. Where multiple pivots from different timeframes converge, the zones stack and intensify in color, creating a "heat signature" that reveals the strongest liquidity levels on your chart.
Key Features
- 10 Customizable Timeframes: Analyze from intraday (15min) to long-term (Monthly) perspectives simultaneously
- Intelligent Density Mapping: Overlapping zones automatically create darker areas showing liquidity confluence
- Fully Adjustable Pivot Detection: Configure left/right bars (2-20) for each timeframe independently
- Adaptive Visualization: Zone height automatically scales with chart zoom for consistent appearance
- Time-Anchored Zones: Zones remain fixed to their exact formation time, never shifting on your chart
- Customizable Transparency: Control global transparency (0-255) to suit your chart style
- Smart Timeframe Filtering: Option to hide lower timeframes based on your current chart view
- Vertical Offset Control: Fine-tune zone positioning with pip-based adjustment
- Separate Color Coding: Red zones for pivot highs (resistance), green for pivot lows (support)
Perfect For
- Smart Money Concepts (SMC) traders identifying liquidity pools
- ICT methodology followers tracking institutional levels
- Swing traders finding high-probability reversal zones
- Scalpers identifying intraday liquidity grabs
- Any trader seeking confluence across multiple timeframes
Trading Applications
The heatmap reveals where stop losses cluster and where institutional orders likely rest. Use these zones to:
- Anticipate liquidity sweeps and reversals
- Identify strong support/resistance confluences
- Find optimal entry points after liquidity grabs
- Set strategic stop losses beyond key liquidity zones
- Confirm breakout validity by observing liquidity consumption
Why This Indicator Stands Out
Unlike basic pivot indicators that show single timeframe levels, this heatmap aggregates data from 10 timeframes simultaneously, giving you a comprehensive view of market structure. The density visualization instantly shows you which levels have the most significance - the darker the zone, the more timeframes agree on that liquidity level.
Performance Optimized
Efficiently processes up to 500 bars per timeframe with smart object management, ensuring smooth chart performance even with all timeframes enabled.
Easy Setup
Install and start trading immediately with optimized default settings, or customize every parameter to match your specific strategy and trading style.
Elevate your liquidity analysis and trade with the insight of institutional order flow. Perfect for traders who understand that price doesn't move randomly - it moves to liquidity.