
Descrizione
RiskLotSizer è un indicatore di dimensionamento della posizione e gestione del rischio basato sul grafico per cTrader, progettato per aiutare i trader a calcolare rapidamente e visivamente la dimensione appropriata della posizione.
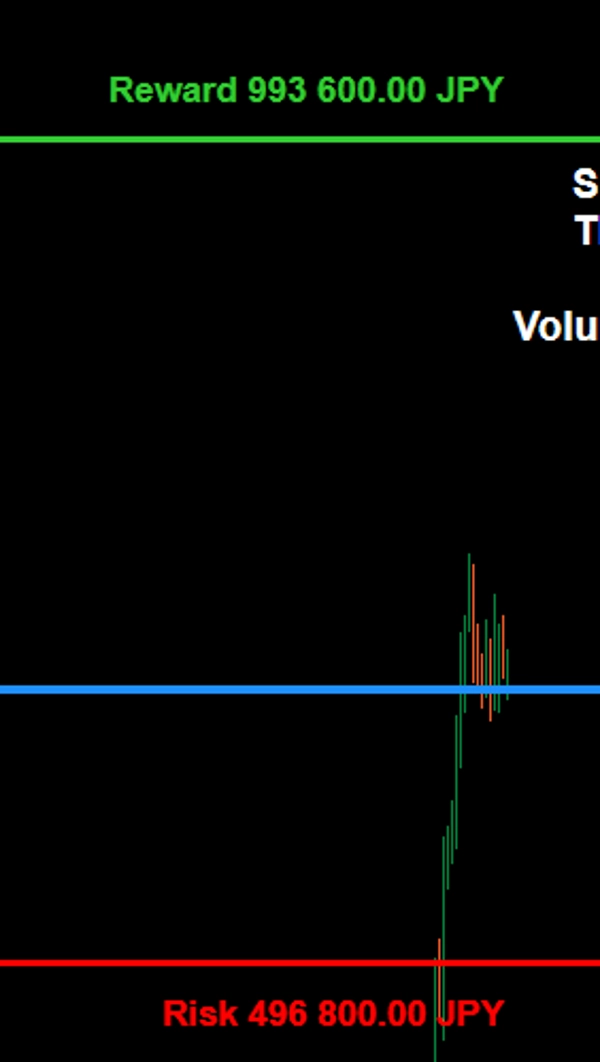
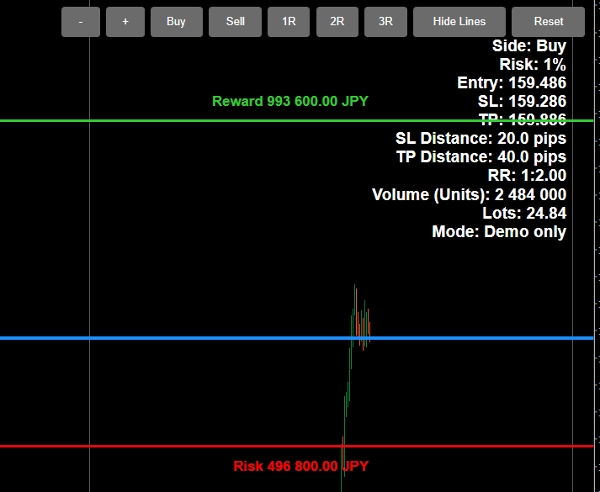
L'indicatore consente di regolare direttamente sul grafico i livelli di Entry, Stop Loss e Take Profit, facilitando la pianificazione delle operazioni in tempo reale. In base alla percentuale di rischio selezionata del capitale del conto, RiskLotSizer calcola automaticamente la dimensione della posizione e mostra la dimensione stimata del lotto, l'importo del rischio, l'importo della ricompensa e il rapporto rischio/ricompensa.
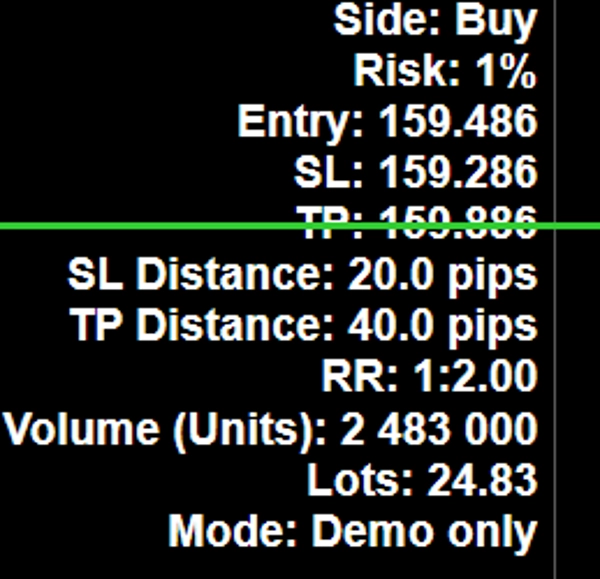
Supporta sia gli scenari di acquisto che di vendita ed è progettato per fornire ai trader una chiara panoramica visiva del rischio dell'operazione prima di entrare in posizione. I valori di rischio e ricompensa sono mostrati direttamente vicino alle linee SL e TP, mentre il pannello informativo principale fornisce un riepilogo chiaro dell'impostazione.
Le caratteristiche principali includono:
- Calcolo della dimensione del lotto basato su una percentuale scelta del capitale
- Linee Entry, SL e TP regolabili direttamente sul grafico
- Visualizzazione in tempo reale della dimensione della posizione, importo del rischio, importo della ricompensa e RR
- Supporto per modalità sia di acquisto che di vendita
- Pulsanti preset RR rapidi per una pianificazione più veloce delle operazioni
- Supporto per le lingue inglese e giapponese
- Interruttore di visibilità delle linee per un grafico più pulito quando necessario
RiskLotSizer è ideale per trader discrezionali, day trader e chiunque desideri un modo più rapido e chiaro per dimensionare le posizioni mantenendo un controllo coerente del rischio.
RiskLotSizer は、チャート上で直感的にポジションサイズを計算できる cTrader 用のポジションサイジング・リスク管理インジケーターです。
Entry、Stop Loss、Take Profit の各ラインをチャート上で直接動かしながら、指定した有効証拠金比率に基づく適正ロット数を自動計算します。これにより、トレード前に必要なロット数、想定損失額、想定利益額、Risk/Reward をリアルタイムで把握できます。
Buy / Sell の両方に対応しており、RR プリセットボタンによって利確目標の調整も素早く行えます。また、SL・TP 付近には損失額・利益額が表示されるため、視覚的にも分かりやすく、実践的なトレード設計をサポートします。
主な特長:
- 有効証拠金に対する指定リスク率からロット数を自動計算
- Entry / SL / TP をチャート上で直接調整可能
- ロット数、損失額、利益額、RR をリアルタイム表示
- Buy / Sell の両方に対応
- RR プリセットボタン搭載
- 英語 / 日本語切替対応
- 必要に応じてライン表示の ON / OFF が可能
RiskLotSizer は、裁量トレーダー、デイトレーダー、そして一貫したリスク管理を重視するトレーダーに適したインジケーターです。
Riepilogo
Recensioni dei clienti
5 | 0 % | |
4 | 100 % | |
3 | 0 % | |
2 | 0 % | |
1 | 0 % |