MACRO_ZERO VOLUME IMBALANCE STRIP
cBot
Versione 1.0, Jun 2026
Windows, Mac, Web
5.0
Recensioni: 1
Trading product for MACRO_ZERO VOLUME IMBALANCE STRIP cBot Fair Value Gap Key Levels, image 2
Trading product for MACRO_ZERO VOLUME IMBALANCE STRIP cBot Fair Value Gap Key Levels, image 3
Trading product for MACRO_ZERO VOLUME IMBALANCE STRIP cBot Fair Value Gap Key Levels, image 4
Trading product for MACRO_ZERO VOLUME IMBALANCE STRIP cBot Fair Value Gap Key Levels, image 5
Trading product for MACRO_ZERO VOLUME IMBALANCE STRIP cBot Fair Value Gap Key Levels, image 6
11.75M
Volume negoziato
168.23K
Profitto in pip
2
Vendite

Descrizione

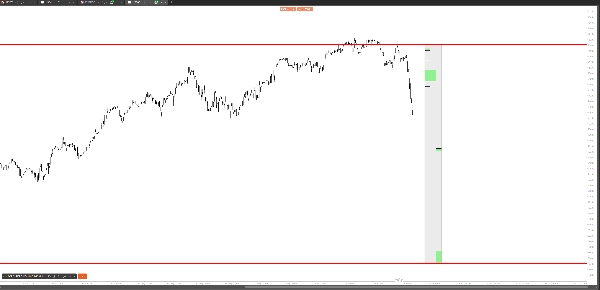
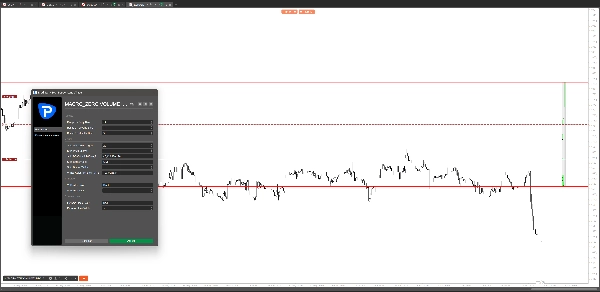
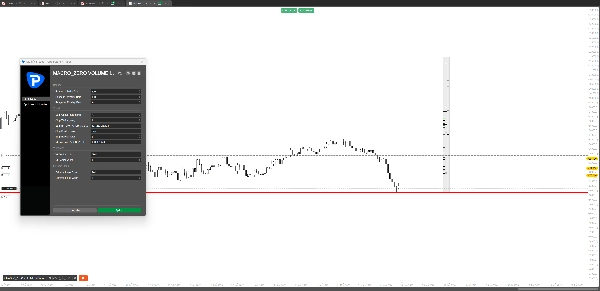
COSA FA Disegna tre strisce verticali affiancate direttamente sul tuo grafico, ciascuna rappresentante zone di squilibrio di volume rilevate simultaneamente su timeframe Giornalieri, Settimanali e Mensili. Tutte e tre le strisce condividono lo stesso massimo e minimo globale — il massimo più alto e il minimo più basso tra tutti gli squilibri rilevati — fornendoti un riferimento visivo immediato dell'intera gamma di squilibrio in gioco. Due linee orizzontali rosse segnano i livelli assoluti di squilibrio più alti e più bassi tra tutti e tre i timeframe e tutte le gamme di barre selezionate — questi sono i tuoi livelli macro chiave. Il prezzo ha una tendenza naturale a rivisitare questi estremi, rendendoli punti di riferimento potenti per obiettivi, posizionamento degli stop e contesto di tendenza. TRADARE CON LO SQUILIBRIO Le zone di squilibrio di volume — note anche come gap di valore equo — sono aree di prezzo dove il mercato si è mosso in modo aggressivo senza partecipazione bilaterale. Queste inefficienze agiscono come calamite. Il prezzo ritorna costantemente a riempire o reagire a questi livelli, rendendo ogni zona un'area ad alta probabilità per: — Reazioni di supporto e resistenza — Punti di ingresso precisi sui ritracciamenti — Obiettivi di profitto sui movimenti di continuazione — Zone di confluenza quando allineate tra i timeframe Quando uno squilibrio Giornaliero, Settimanale e Mensile si sovrappone allo stesso livello di prezzo, quella confluenza diventa una delle aree più forti sul tuo grafico. Il pannello a tre strisce rende questo allineamento immediatamente visibile — nessuna analisi manuale richiesta. PANNELLO A TRE STRISCE Ogni striscia corrisponde a un timeframe — Giornaliero a sinistra, Settimanale al centro, Mensile a destra. Le strisce sono disegnate a destra dell'ultima barra con un offset configurabile, posizionate una accanto all'altra con bordi individuali in modo che ogni timeframe sia chiaramente separato. Lo sfondo copre l'intera gamma globale; le caselle di squilibrio sono disegnate ai loro esatti livelli di prezzo all'interno di ogni striscia. Disclaimer sul rischio: Il trading di strumenti finanziari comporta un rischio sostanziale di perdita. Le zone di squilibrio di volume sono solo riferimenti analitici e non garantiscono una reazione del prezzo. Questo strumento non costituisce consulenza finanziaria. Applica sempre una corretta gestione del rischio. ⚠️ Avviso di rischio: Il comportamento passato del prezzo nelle zone di squilibrio non è indicativo di risultati futuri. Tradare responsabilmente e solo con capitale che puoi permetterti di perdere.

Riepilogo

Riepilogo AI
MACRO_ZERO VOLUME IMBALANCE STRIP is a multi-timeframe volume imbalance visualization tool designed for cTrader. It displays three vertical strips side-by-side on the chart, each representing volume imbalance zones—also known as fair value gaps—detected on Daily, Weekly, and Monthly timeframes. These strips share a common global high and low, highlighting the full range of imbalances across all timeframes. Two red horizontal lines mark the absolute highest and lowest imbalance levels, serving as key macro reference points.
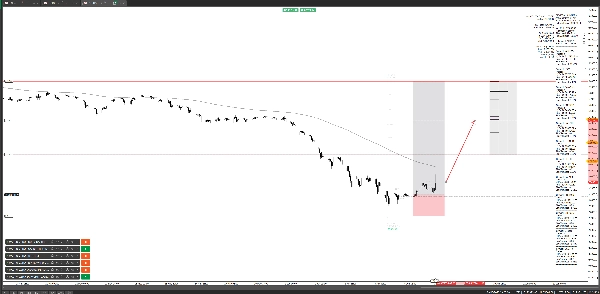
Volume imbalance zones indicate price areas where market moves occurred with limited two-sided participation, often acting as magnets where price tends to revisit. This tool helps identify high-probability areas for support and resistance reactions, precision entries on pullbacks, profit targets on continuation moves, and confluence zones when imbalances align across multiple timeframes.
The three-strip panel is positioned to the right of the last bar with configurable offset and clear borders separating each timeframe. The background spans the full global imbalance range, with imbalance boxes drawn at exact price levels within each strip. This visualization aids traders in quickly assessing macro-level volume imbalances without manual analysis.
Profilo di trading

Recensioni dei clienti

5.0
Recensioni: 1
5
100 %
4
0 %
3
0 %
2
0 %
1
0 %
Recensioni dei clienti
July 2, 2026
An innovative visualization tool for ICT and SMC traders that compresses Daily, Weekly, and Monthly volume imbalance analysis into a compact three-strip panel. The indicator excels at identifying multi-timeframe confluence zones while keeping the chart clean and readable. Best suited for experienced discretionary traders working with market structure and fair value gap concepts.

Discussioni

Domande frequenti

Fair Value Gap
Key Levels
Imbalance
Volume
Support & Resistance
I prodotti disponibili tramite cTrader Store, inclusi bot di trading, indicatori e plugin, sono forniti da sviluppatori terzi e resi disponibili esclusivamente a scopo informativo e di accesso tecnico. cTrader Store non è un broker e non fornisce consulenze in materia di investimento, raccomandazioni individualizzate o garanzie di risultati futuri.

Altro da questo autore

cBot
ADX
ATR
+5
Analyze quarterly cycles and weekly seasonality patterns across multiple instruments with historical bias data
cBot
Forex
BTCUSD
+5
HTF candles (1H, 4H, 8H, 12H, 16H, 1D, 20D, 1W, 1M) Charts (15M-Daily).
cBot
SMC
Forex
+5
Advanced volatility calculator with OB/BB Block detection and real-time alert system for analysis
Indicatore
ATR
Breaker Block
+5
Display your symbol, timeframe or custom text as a watermark on any chart position with full color and size control.
cBot
Key Levels
SL Manager
+4
Multi-symbol dashboard with 3 fixed charts, dynamic position slots ranked by profit, Ratio analysis, MZ phase detection
cBot
Key Levels
SL Manager
+4
RISK REWARD VISUALIZER Part of the MACRO ZERO Suite Visualize your active positions, pending orders, and cl
cBot
SMC
Forex
+5
Multi-timeframe OHLC bars + projection levels from session analysis. Alerts on key level crosses. No trading execution.

Potrebbe interessarti anche

cBot
AI
ATR
+27
Overnight trades? Pc needs shut down? Sleep disruption from alerts? Could have avoided Loss with BE Partial Monitored ?
cBot
ATR
RSI
+17
The Swiss Army Knife cBot is a multi-tool trading robot that combines 10 of the most popular technical indicators
cBot
Forex
EURUSD
Easy Trade, Just Plug and Play!
cBot
Grid
XAUUSD
+2
🔥 Grid Classic – A Simple Yet Powerful Grid System
cBot
Set your daily and weekly limits and the bot will block trading once they are reached – simple protection.
cBot
Forex
Scalping
Special H1-Version of UltimateScalper for EUR/GBP ... win rate 100% ... ROI 830%
cBot
XAUUSD
Martingale
IBC Advanced Strategy - IBC高级策略,基于马丁策略的优化版本,添加止损配置
cBot
Prop
Forex
+11
Manage trades visually! Secure profits with Auto Partials & Trailing Shield. Works on all cTrader markets.
35.2%
ROI
4
Fattore di profitto
cBot
Fixed Risk %
Risk/Reward
+5
One-click fixed-risk execution with a built-in daily loss guard. Made for manual traders and prop challenges.
0.01
Fattore di profitto
cBot
Conservative
Grid Recovery
Ziggy, an advanced algorithm designed to maximize efficiency and simplify profit control.
cBot
RSI Scalping cBot scalper for volatile indexes.
cBot
ATR
EMA
+5
Momentum driven, Compounding. Volatility adaptive EMA BOLLINGER ATR base Strategy
93.4%
ROI
1.31
Fattore di profitto
cBot
Forex
Crypto
+3
TrendSniffer hunts market momentum like a wolf — detecting trends early for smart, automated trading.
cBot
Key Levels
Spread Filter
+3
MATRIX INFINITY, See Beyond the Market.
22.3%
ROI
31
Fattore di profitto
cBot
ATR
Forex
+2
Auto-Breakeven Bot w/ ATR & dual triggers. Works 100% with Risk Reward Guardian. Was Free for early users now -80%
cBot
AI
ATR
+8
AI Trading that you can adjust to your own strategy, this AI will do a work for you, Adjust to suit your own strategy
cBot
Fibonacci
Fixed Lot
+5
Trading dashboard for fast order execution, position management, risk controls and automatic Fibonacci levels.
1.52
Fattore di profitto
cBot
Indices
Scalping
HIGHLY PROFITABLE NASDAQ100 SCALPING ALGORITHM
7%
ROI
3.46
Fattore di profitto

Prezzo

11.75M
Volume negoziato
168.23K
Profitto in pip
2
Vendite