
Açıklama
**Vmm Signal Trend Pro - cTrader için Gösterge**
**Genel Açıklama**
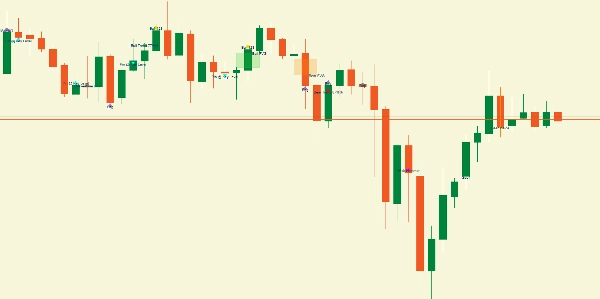
Vmm Signal Trend Pro, cTrader platformu için gerçek zamanlı olarak birden fazla fiyat desenini tespit eden gelişmiş bir teknik analiz göstergesidir. Trend tespiti, mum çubuğu desenleri, FVG'ler (Adil Değer Boşlukları), boşluklar ve diğer önemli desenleri tek bir görsel göstergede birleştirir.
**Ana Özellikler**
**1. Trend Tespiti**
- **Fiyat Hareketi Analizi**: Son N mum üzerindeki fiyat hareketiyle trendleri tanımlar
- **Trend Gücü**: Momentum ve yapıya dayalı güç yüzdesini hesaplar
- **Yön İkonları**: Trend güçlü olduğunda yeşil ok (yukarı) veya kırmızı ok (aşağı)
**2. Tespit Edilen Desenler**
**Adil Değer Boşluğu (FVG)**
- **Boğa FVG**: Mevcut dip, 2 mum öncesinin yüksek seviyesinden büyük olduğunda
- **Ayı FVG**: Mevcut yüksek, 2 mum öncesinin düşük seviyesinden küçük olduğunda
- **Renkli Alanlar**: Yarı saydam dikdörtgenler (yeşil/turuncu)
**Boşluklar**
- **Yukarı Boşluk**: Önceki yüksek seviyenin üzerinde açılış
- **Aşağı Boşluk**: Önceki düşük seviyenin altında açılış
- **Görselleştirme**: Mum açılışında küçük dikdörtgenler
**İç Mumlar**
- Mum tamamen önceki mumun aralığında
- Yöne göre renk farklılaştırması (sarı/turuncu)
**123 Deseni (Ters)**
- **Boğa 123 Deseni**: Yukarı kırılmalı üç nokta
- **Ayı 123 Deseni**: Aşağı kırılmalı üç nokta
- **Sinyal**: Altın renkli dairesel ikon
**Fitil Desenleri**
- **Çekiç benzeri**: Önemli alt fitil
- **Yıldız benzeri**: Önemli üst fitil
- **İkon**: Macenta Yıldızı
**Çivili Mumlar**
- Uzun fitil (≥2x gövde) ve küçük gövde
- Yakın ana seviyelerin tespiti
- **İkonlar**: Yukarı/Aşağı Üçgen (camgöbeği)
**Yutma**
- **Boğa Yutma**: Boğa mumu önceki ayı mumunu yutar
- **Ayı Yutma**: Ayı mumu önceki boğa mumunu yutar
- **İkon**: Mor Elmas
**Doji**
- Çok küçük gövde (varsayılan olarak toplam aralığın ≤%10'u)
- Özel tipler: Mezarlık, Yusufçuk, Uzun Bacaklı
- **İkon**: Gri Daire
**3.** Destek/Direnç Sistemi**
- Salınım yüksek/düşüklerinin otomatik tespiti
- Önem derecesini artırmak için ana seviyelere yakınlığı dikkate alır
**4. Akıllı Filtreleme**
- **Türüne Göre Sınır**: Kategori başına maksimum sinyal sayısı
- **Zaman Aralığı**: Çok yakın sinyallerin önlenmesi
- **Trend Filtresi**: Karşı trend sinyallerine izin verme/izin verme seçeneği
- **Minimum Güç**: Zayıf sinyalleri filtreler
**Yapılandırılabilir Parametreler**
**Temel Ayarlar**
- `Trend Yönünü Göster`: Trend oklarını etkinleştirir
- `Önceki Mum Kontrolü`: Analiz için mum sayısı
- `Trend Gücü Eşiği`: Güçlü trend olarak kabul edilecek minimum yüzde
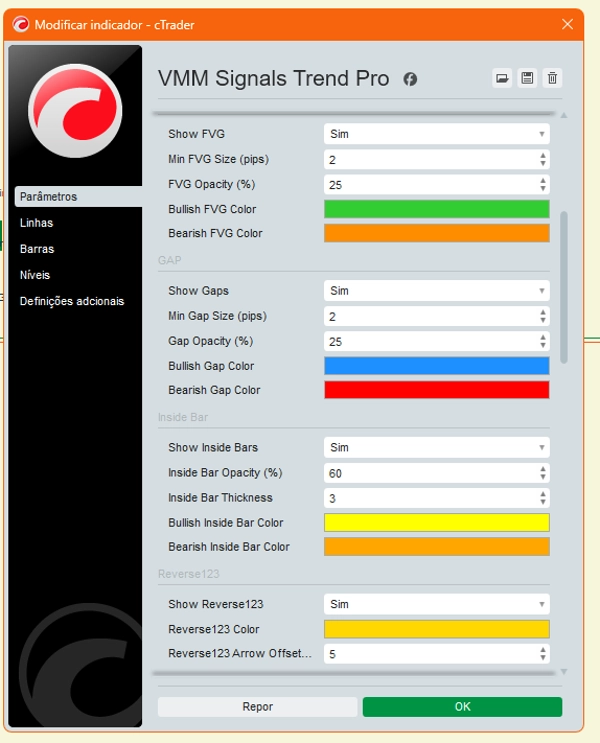
**FVG**
- `Min FVG Boyutu`: Minimum pip cinsinden boyut
- `Opaklık`: Alanların saydamlığı
- `Renkler`: Özelleştirilebilir renkler
**Boşluklar**
- `Min Boşluk Boyutu`: Minimum pip cinsinden boyut
- `Renkler`: Yukarı/aşağı boşluklar için renkler
**İç Mumlar**
- `Kalınlık`: Çizgi kalınlığı
- Opaklık: Saydamlık
- Renkler: Yöne göre farklılaştırılmış renkler
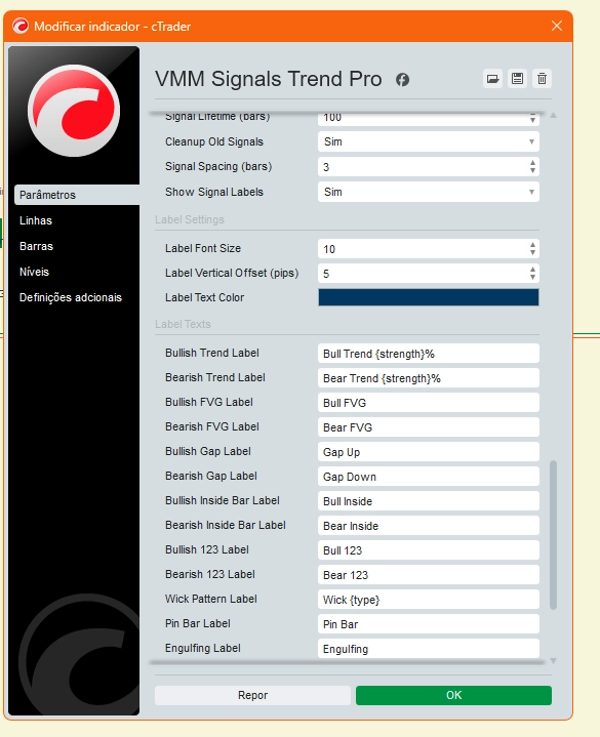
Sinyaller:
- Sinyal Ömrü: Sinyalin süresi (mum cinsinden)
- Sinyal Aralığı: Sinyaller arasındaki minimum mesafe
- Tür Başına Maksimum Sinyal: Kategori başına sınır
Özel Etiketler:
- Özelleştirilebilir Metin: Her desenin kendi yapılandırılabilir metni vardır
- Yer Tutucular: `%{strength}` güç yüzdesi için, `%{type}` belirli tür için
- Biçimlendirme: Yazı tipi boyutu, dikey kaydırma, renkler
- Kısa Mod: Yoğun grafikler için kısaltılmış etiketler
İç Mekanikler:
1. Trend Analizi:
- Doğrusal Regresyon: Trend eğimini hesaplar
- Mum Sayısı: Son N dönemde boğa ve ayı mumları
- Momentum: Hareketlerin büyüklüğünü dikkate alır
2. Nesne Yönetimi**
- **Nesne Önbelleği**: Mevcut sinyallerin yeniden çizilmesini önler
- **Otomatik Temizlik**: Ömür süresine göre eski sinyalleri kaldırır
- **Tür Bazlı Sayaçlar**: Maksimum miktarı kontrol eder
**3. **Güç Hesaplama**
- Her desenin özel bir güç formülü vardır
- Oranlar, pip mesafeleri, ana seviyelere yakınlığa dayanır
- Aralık: %0-100
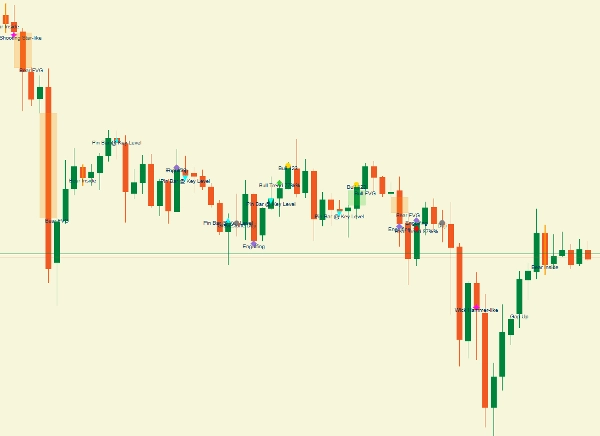
**Grafik Görselleştirme**
**Grafik Öğeleri**
1. **İkonlar**: Oklar, üçgenler, daireler, elmaslar, yıldızlar
2. **Alanlar**: Yarı saydam dikdörtgenler (FVG/Boşluklar)
3. **Çizgiler**: Vurgulanmış iç mumlar
4. **Etiketler**: Sinyallerin yanında bilgilendirici metin
**Renk Kodu**
- **Yeşil**: Boğa (trend, FVG, boşluklar)
- **Kırmızı/Turuncu**: Ayı (trend, FVG, boşluklar)
- **Sarı/Turuncu**: İç mumlar (boğa/ayı)
- **Altın**: 123 deseni
- **Macenta**: Fitil desenleri
- **Camgöbeği**: Çivili mumlar
- **Mor**: Yutma
- **Gri**: Doji
**Avantajlar**
**Tüccarlar için**
- **Hepsi bir arada**: Tek bir göstergede birden fazla desen
- **Özelleştirilebilir**: Her desen için ince ayar
- **Net görsel**: Sezgisel renk kodlaması
- **Filtreleme**: Sinyal aşırı yüklemesini önler
**Kullanım Alanları**
**1. Hızlı Analiz**
- Mevcut trendi belirleyin
- Son FVG'leri ve boşlukları kontrol edin
- Ters dönüş desenlerini tespit edin
**2. Giriş Onayı**
- Olasılığı artırmak için birden fazla deseni birleştirin
- Trend ile uyumu kontrol edin
- Sinyal gücünü dikkate alın
**3. Risk Yönetimi**
- Yakın destek/direnç seviyelerini belirleyin
- İlgi alanları olarak FVG'leri kullanın
- Sinyal aralığını dikkate alın
**Sınırlamalar**
**Bağımlılıklar**
- **Dalgalı piyasalar**: Çok sayıda sinyal üretebilir
- **Zaman dilimleri**: Ayarlar zaman dilimine göre ayarlanabilir
- **Varlıklar**: Davranış döviz çiftine göre değişir
**Dikkat Edilmesi Gerekenler**
- **Tahmin edici değildir**: Geçmiş desenler geleceğin garantisi değildir
- **Onay gereklidir**: Her zaman ek analizle doğrulayın
- **Yanlış sinyaller**: Filtreler azaltır ama tamamen ortadan kaldırmaz
**Kullanım Önerileri**
**İlk Ayarlar**
1. `Akıllı Filtreleme = true` ile başlayın
2. Tarzınıza göre `Min Sinyal Gücü`nü ayarlayın
3. Aşırı yüklemeyi önlemek için `Sinyal Aralığı`nı kullanın
4. Daha iyi görselleştirme için renkleri özelleştirin
**Etkili Kombinasyonlar**
- **Trend + FVG**: Güçlü uyum
- **İç mum + Ana seviye**: İyi giriş alanı
- **Çivili mum + Yutma**: Ters dönüş onayı
- **123 + Trend**: Muhtemel devam
**İzleme**
- Konsoldaki kayıtları periyodik olarak kontrol edin
- Piyasa koşullarına göre parametreleri ayarlayın
- Diğer göstergelerle birlikte kullanın
Bu gösterge, fiyat hareketi ve görsel desenlere odaklanan kapsamlı teknik analiz arayan tüccarlar için eksiksiz bir araçtır ve sinyallerin özelleştirilmesi ve filtrelenmesinde tam esneklik sunar.
**⚠️ ÖNEMLİ UYARI**
Bu gösterge BİR TEKNİK ANALİZ ARACIDIR. Üretilen sinyaller algoritmalara dayalı ÖNERİLERDİR, yatırım tavsiyesi DEĞİLDİR. Ticaret önemli kayıp riski taşır. Geçmiş performans geleceği garanti etmez. Tüccar tüm ticaret kararlarından TAM SORUMLUDUR. Her zaman uygun risk yönetimi kullanın ve canlı işlem öncesi demo hesaplarda test edin.


!["Wyckoff Toolkit [Iridio Capital]" logosu](https://cdn.ctrader.com/image/webp/8acfe6a1-6a8e-4578-9367-9df3af2b1801_27763)