
SMA_Cross_Signal
インジケーター
111 ダウンロード数
バージョン 1.0、Jan 2026
Windows、Mac
説明
2つの単純移動平均線(SMA)のクロスオーバーを検出し、チャート上にすべてを明確に表示する、クリーンでシンプルかつ視覚的に優れたインジケーターです。
主な特徴:
- 正確なクロスオーバーポイントに大きなカラー矢印 → ライムグリーン ↑ → 強気のクロスオーバー(買いの可能性) → 赤 ↓ → 弱気のクロスオーバー(売りの可能性)
- チャートの右上隅に常設のステータスパネル → 最新のクロスオーバーの種類(強気 / 弱気 / 待機) → クロスオーバーの正確な日時 → 設定された移動平均の期間
- 100% ノンリペイント
- 同じバーでの重複シグナルを防止
- クロスオーバーが発生するたびにログにメッセージを出力(追跡に最適)
- 非常に軽量で、どの時間軸でも完璧に動作
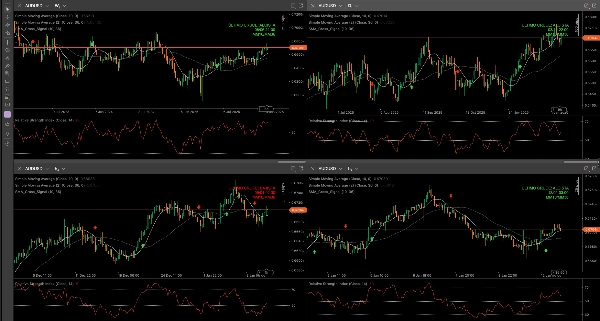
私のお気に入りの使い方(おすすめの方法):
同じ通貨ペアの週足、日足、4時間足、および1時間足の時間軸に同時に適用します。
主に1時間足でエントリーしますが、上位時間軸にインジケーターを表示することで、通貨ペアの支配的な方向性を非常に強力な全体像として把握できます:
- 週足と日足で強気/弱気のクロスオーバーが一致しているか? → 確率が高い
- 時間軸間でシグナルが矛盾している? → 待つかポジションサイズを減らす方が良い
よく使われる効果的な設定:
- 9 / 21
- 10 / 30
- 21 / 50
- 50 / 200(特に週足と日足で有用)
初心者にはその明確な視覚効果とシンプルさで最適であり、経験豊富なトレーダーにはプライスアクション、サポート/レジスタンス、またはボリュームと組み合わせるためのクリーンなベースとして最適です。
cTraderコミュニティ全体に完全無料で提供!
デモで試し、マルチタイムフレームモードで適用し、気に入ったら…お気に入りの設定や最も効果的な通貨ペアについてコメントを残してください😊
皆さん、良いトレードを!
概要
AIによる概要
SMA Cross Signal is a visual trading indicator that identifies crossovers between two Simple Moving Averages (SMAs) on a chart. It marks bullish crossovers with lime green upward arrows and bearish crossovers with red downward arrows at the exact crossover points. A permanent status panel in the chart’s top-right corner displays the latest crossover type (Bullish, Bearish, or Waiting), the exact date and time of the crossover, and the configured SMA periods.
Key features include non-repainting signals, prevention of duplicate alerts on the same bar, and log messages for each crossover event. The indicator is lightweight and compatible with any timeframe, making it suitable for multi-timeframe analysis. Commonly used SMA period pairs include 9/21, 10/30, 21/50, and 50/200, with the latter especially useful on weekly and daily charts.
Traders often apply the indicator simultaneously on weekly, daily, 4-hour, and 1-hour timeframes to gain a comprehensive view of market direction and improve entry timing. It supports various markets including Forex and popular symbols like EURUSD, GBPUSD, USDJPY, XAUUSD, and BTCUSD. The indicator is designed for both beginners and experienced traders seeking clear, straightforward moving average crossover signals.
インジケーターのプロフィール
カスタマーレビュー
0.0
レビュー: 0
カスタマーレビュー
この商品にはまだレビューがありません。お使いになったことがある方は、ぜひレビューをお願いします。
ディスカッション
よくあるご質問
BTCUSD
Forex
Signal
EURUSD
GBPUSD
XAUUSD
USDJPY
cTrader Storeで入手可能な取引ボット、インジケーター、プラグインなどの商品は、第三者の開発者が提供するものであり、情報と技術の取得のみを目的としてご利用いただけます。cTrader Storeはブローカーではなく、投資助言や個人的な推奨を行うことも、将来のパフォーマンスを保証することもありません。


価格
登録日 10/03/2025
111
無料インストール