
Fear & Greed Index
インジケーター
364 ダウンロード数
バージョン 1.0、Jun 2025
Windows、Mac
5.0
レビュー: 1
説明
Pinescriptlabs ストアのインジケーター: Pinescriptlabs ストア cBots : (cBot) Gold & BTC ブレイクアウトセッションピボット(新着)
トレーリングスマートアルゴリズム(新着)
恐怖と欲望指数
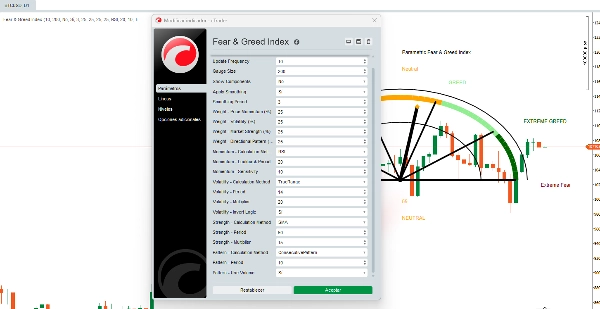
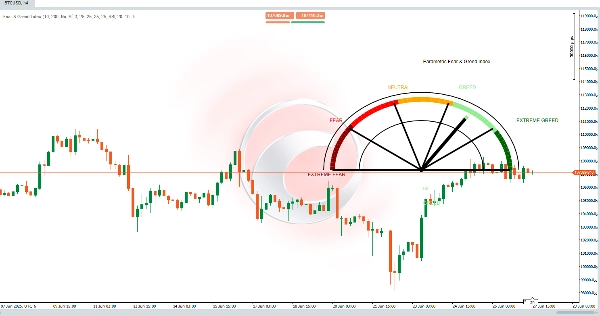
この 恐怖と欲望 インジケーターは、市場のセンチメントを 0-100の値 に統合する高度な視覚的アルゴリズムで、 半円形のゲージを使用しています。基本的なバージョンとは異なり、このツールは 完全にカスタマイズ可能で、トレーダーは計算のあらゆる側面を調整できます。
📊 4つのコアコンポーネント(設定可能)
1️⃣ 価格モメンタム *(設定可能な重み:0-100%)*
6つの計算方法が利用可能:
- PriceChange: 前期間に対する単純な%変化
- ROC: 正規化された変化率
- RSI: モメンタム用に修正されたRSI
- SMADeviation: SMAからの価格偏差
- EMADeviation: EMAからの価格偏差
- MACD: モメンタム指標としてのMACDシグナル
🔧 カスタマイズ可能なパラメータ:
- ルックバック期間 *(5-100)*
- 計算感度 *(1.0-50.0)*
2️⃣ ボラティリティ *(設定可能な重み:0-100%)*
6つの計算方法が利用可能:
- TrueRange: True Rangeに基づくボラティリティ
- HighLowRange: 単純な高値-安値レンジ
- CloseToClose: 対数的な終値間ボラティリティ
- ATR: 標準的な平均真の範囲
- StandardDev: 価格の標準偏差
- ParkinsonVol: Parkinsonのボラティリティ推定器
🔧 カスタマイズ可能なパラメータ:
- 計算期間 *(5-50)*
- ボラティリティ乗数 *(1.0-100.0)*
- 論理反転 (ボラティリティが高い = 恐怖が強い)
3️⃣ 市場の強さ *(設定可能な重み:0-100%)*
6つの計算方法が利用可能:
- SMA: 単純移動平均に対する位置
- EMA: 指数移動平均に対する位置
- VWAP: 出来高加重平均価格に対する位置
- HLBand: 高値-安値バンド内の位置
- BollingerPos: ボリンジャーバンド内の位置
- PivotDistance: ピボットポイントまでの距離
🔧 カスタマイズ可能なパラメータ:
- 計算期間 *(10-200)*
- 強度乗数 *(1.0-50.0)*
4️⃣ 方向性パターン *(設定可能な重み:0-100%)*
6つの計算方法が利用可能:
- BullBearRatio: 強気/弱気キャンドル比率
- VolumePattern: ボリュームトレンド分析
- BodySizePattern: キャンドルボディサイズ分析
- WickPattern: ウィックパターン分析
- GapPattern: ギャップ検出と分析
- ConsecutivePattern: 連続価格変動分析
🔧 カスタマイズ可能なパラメータ:
- 分析期間 *(5-30)*
- 計算におけるボリュームの使用 (オプション)
⚙️ 高度な機能
🔹 柔軟な重み付けシステム
- コンポーネントごとのカスタム重み *(0-100%)*
- 重みの合計が100%に満たない場合の自動正規化
- 最適でない設定に対する警告
🔹 スマートスムージング
- ノイズを減らすためのオプションのスムージング
- 調整可能なスムージング期間 *(1-10)*
- 最終結果に適用されるSMAフィルター
🔹 完全にカスタマイズ可能な表示
- ゲージサイズ *(50-500px)*
- 更新頻度 *(1-50バー)*
- オプションのコンポーネント分解 (個別の値を表示)
- インストゥルメントとタイムフレームに自動適応
🔄 アルゴリズムのプロセス
ステップ4:可視化
半円形のゲージは 5つのカラ―ゾーンを表示します:
- 0-20: 極度の恐怖
- 21-40: 恐怖
- 41-60: 中立
- 61-80: 欲望
- 81-100: 極度の欲望
✅ 完全にカスタマイズ可能なシステム:
🎯 完全な柔軟性
- あらゆる市場に適応: 外国為替、暗号通貨、株式、商品
- タイムフレーム別: スキャルピングとスイングトレードの異なる設定
- 市場の変化に応じて戦略を調整
概要
AIによる概要
The Fear & Greed Index indicator is a customizable market sentiment tool that synthesizes multiple data components into a single 0-100 value displayed on a semi-circular gauge. It integrates four configurable core components—Price Momentum, Volatility, Market Strength, and Directional Pattern—each with six selectable calculation methods. Users can adjust weights for each component, with automatic normalization and warnings for suboptimal settings. The indicator supports parameters such as lookback periods, calculation sensitivity, volatility multipliers, and optional volume usage. It features smart smoothing options to reduce noise and a fully customizable display including gauge size, update frequency, and optional component breakdown. The gauge visualizes sentiment across five color-coded zones: Extreme Fear (0-20), Fear (21-40), Neutral (41-60), Greed (61-80), and Extreme Greed (81-100). Designed to adapt to any market—including Forex, Crypto, Stocks, and Commodities—and various timeframes, it allows traders to tailor settings for scalping or swing trading. The system evolves with market conditions, providing a flexible and detailed sentiment analysis tool for diverse trading strategies.
インジケーターのプロフィール
カスタマーレビュー
5.0
レビュー: 1
5 | 100 % | |
4 | 0 % | |
3 | 0 % | |
2 | 0 % | |
1 | 0 % |
ディスカッション
よくあるご質問
BTCUSD
Forex
Signal
Breakout
Indices
Commodities
RSI
Bollinger
Scalping
Supertrend
Crypto
Stocks
XAUUSD
ATR
MACD
VWAP
cTrader Storeで入手可能な取引ボット、インジケーター、プラグインなどの商品は、第三者の開発者が提供するものであり、情報と技術の取得のみを目的としてご利用いただけます。cTrader Storeはブローカーではなく、投資助言や個人的な推奨を行うことも、将来のパフォーマンスを保証することもありません。


価格
登録日 03/10/2024
163
販売
37.8K
無料インストール