
present
Registe-se e receba 50 $ de desconto na sua primeira compra
Trading product for Regime Compass Indicador EMA, image 1
Regime Compass
Indicador
Versão 1.0, Aug 2026
Windows, Mac
Trading product for Regime Compass Indicador EMA, image 2
Trading product for Regime Compass Indicador EMA, image 3
Trading product for Regime Compass Indicador EMA, image 4
Desde 15/08/2026

Descrição

WHAT IT DRAWS


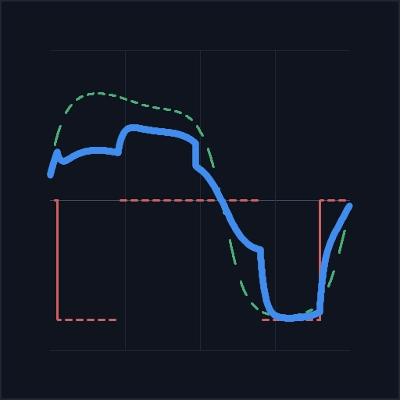
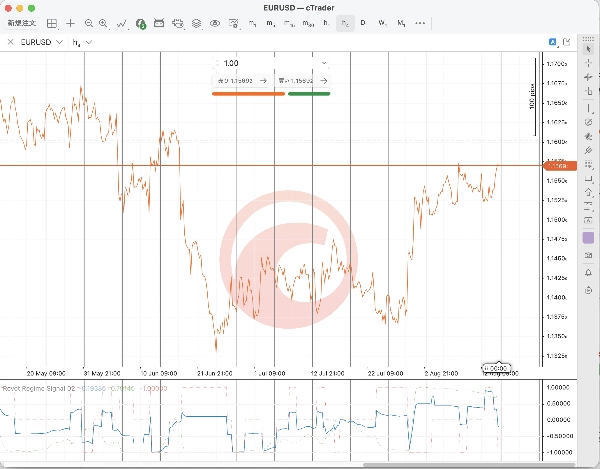
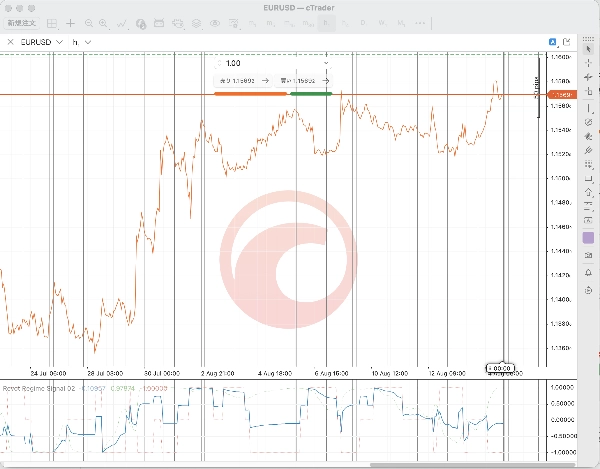
Three lines in a sub-panel below your chart.


Blended signal, blue and solid. The combined value, held between minus one and plus one.


Trend component, green and dotted. The trend half on its own.


Reversion component, red and dotted. The mean-reversion half on its own.


Seeing the two halves separately is the point. When they disagree, the blend sits near zero and you can see which side is pulling.


HOW IT IS COMPUTED


The trend half takes the ratio of a fast EMA to a slow EMA, minus one. That relative distance is standardised over its own history, bounded, and passed through tanh, so the line scales with how unusual the current separation is instead of flipping on every crossover.


The reversion half is a z-score of close over a fixed lookback. The state turns one way when the z-score reaches the entry level, the other way at the mirror level, and flattens once the z-score falls back inside the exit band. It holds its previous state in between, which is why the red line moves in steps rather than continuously.


The weighting compares short-window return volatility against long-window return volatility. When the short window runs hot relative to the long window, the blend leans towards the trend half. Otherwise it leans towards the reversion half. Follow the market when it is moving, fade it when it is quiet.


DECISION TIMING


Everything is computed on completed bars only. The forming bar is never drawn, so a value you have already seen does not change afterwards. The reversion state advances exactly once per closed bar, so a chart recalculation replays the same history rather than double-counting it.


WHAT IT DOES NOT DO


It places, modifies, cancels and closes no orders. It reads only the chart symbol's own bars. No network access, no file access, no external data feed.


It is a display. It does not forecast, and every trading decision stays yours.


PARAMETERS


The trend periods, the reversion lookback, the entry and exit levels, the two volatility windows and the weighting are fixed in this build. The line you see is one specific configuration rather than a surface you tune until it looks right.


SCOPE


This indicator was developed and checked on one instrument over one historical window. That says nothing about how it behaves on another symbol, another timeframe or another period. Run it on a demo account, on the instruments you actually trade, and decide for yourself whether the behaviour suits you.


Trading carries risk of loss.


SUPPORT


Questions answered within 3 business days. Version history published with every change.


Resumo

Perfil do indicador
Categoria do indicador
Tendência
Tipo de resultado
Visualização
Requisitos de dados
Apenas barras
Sinais suportados
Força da tendência
Inversão
Volatilidade

Avaliações de clientes

0.0
Avaliações: 0
Avaliações de clientes
Ainda não há avaliações para este produto. Já o experimentou? Seja o primeiro a contar a outras pessoas!

Conversa

Perguntas frequentes

EMA
Os produtos disponíveis através da cTrader Store, incluindo bots de negociação, indicadores e plugins, são fornecidos por programadores terceiros e são disponibilizados apenas para fins informativos e de acesso técnico. A cTrader Store não é um corretor e não fornece aconselhamento em matéria de investimento, recomendações pessoais ou qualquer garantia de desempenho no futuro.

Também poderá gostar de

Indicador
AI
ATR
+5
🦅 AI Institutional System: Order Blocks, Volume Delta Profile, OrderFlow Limit Buy/Sell, MTF, psychology & reversal.
Indicador
Signal
Indices
The **Whale Hunting Indicator** is a trading tool for **Boom & Crash and Volatility indices**, featuring **Auto Trend De
Indicador
ATR
RSI
+5
🚀 HAI QUANTUM v4.0 | The Ultimate Quantum Terminal for cTrader (Smart Money & Algorithmic Trading)
Indicador
EMA
Channel
+2
WaveTrend Oscillator implementation for cTrader based on LazyBear's popular TradingView indicator.
Indicador
Imbalance
Key Levels
+2
A Next-Generation Adaptive Oscillator with Z-Score Regime Engine.
Indicador
SMA
Volume
+3
Stoc​h PRO Quad Rotation Signal (QRS) is an advanced technical analysis indicator developed for cTrader.
Indicador
Prop
VWAP
+15
VWAP with standard deviation bands. Fully customizable colors, periods, and multipliers for precise trading signals
Indicador
Forex
Indices
+5
Market Profile TPO for cTrader — full auction logic, IB, POC, VA zones, histogram and O/X markers with time
Indicador
Supertrend
Premium visual market-regime indicator for cTrader. Works beautifully with BTC on the 1D timeframe.
Indicador
SMC
BTCUSD
+5
SMC ICT Control Panel The all-in-one Smart Money command center for cTrader. One indicator. Every SMC/ICT tool. Zero clu
Indicador
ADX
ATR
+3
Nine live gauges turn raw market data into one clear dashboard. Trend, volume, volatility - at a glance, any symbol.
Indicador
Forex
Crypto
+3
This is a tool to help traders open orders/close orders/modify orders quickly with just one click
Indicador
Forex
Crypto
+5
Volume Imbalance Bars Indicator - brings institutional-grade market microstructure analysis to cTrader.
Indicador
AI
ATR
+18
Advanced Level 2 market analysis tool.
Indicador
Liquidity Grab
Liquidity Sweep
+2
Visualizes accumulation ranges, manipulation sweeps and distribution phases on your cTrader chart.
Indicador
RSI
Signal
The Wyckoff Toolkit is the ultimate ally for traders seeking to decode the market through the lens of "smart money."
Indicador
AI
ATR
+27
Imperium MTF Heatmap is a unique top-tier indicator for cTrader, created for traders who want more than signals
Indicador
AI
ATR
+27
VWAP Sniper Elite -- Institutional Trend Engine

Preço

Desde 15/08/2026