
Açıklama
Full Product Summary: Quantum Currency Array Lite
Overview & Market Data Analysed
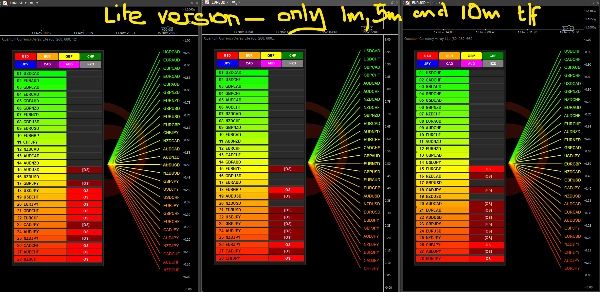
The Quantum Currency Array Lite is a multi-currency analytical dashboard designed to map directional slope across 28 primary and cross currency pairs simultaneously on intraday timeframes. Using a linear regression slope calculation over a configurable lookback period (default: 80 bars), the indicator plots a visual fan of all 28 pairs alongside a ranked two-column ladder. This Lite edition operates on the 1-minute, 5-minute, and 10-minute timeframes.
Because the indicator uses a longer lookback period, it takes a more 'considered view' of trend changes and was developed particularly for swing and trend traders. (It is therefore a complementary indicator alongside the currency matrix, which has a short-term lookback period for scalping traders.)
Understanding the Visual Fan & Ranking Ladder
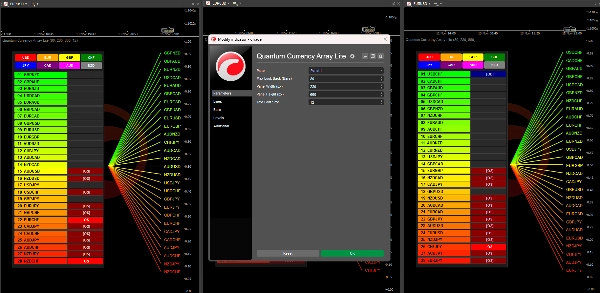
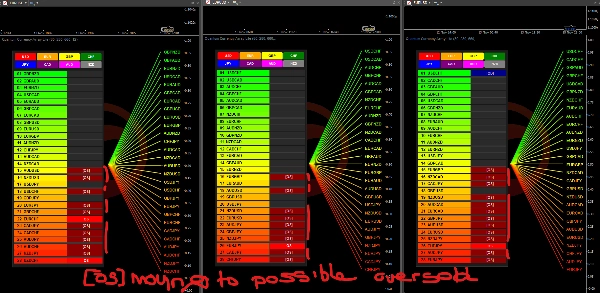
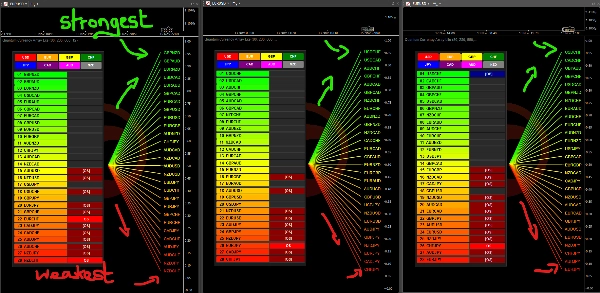
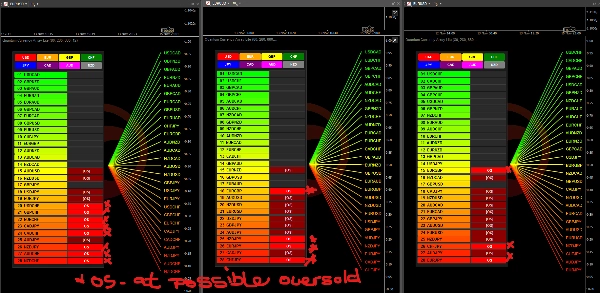
- Visual Regression Fan: Projects 28 colour-graded rays from a central fulcrum axis, illustrating the relative spread and angle of each currency pair over the lookback window.
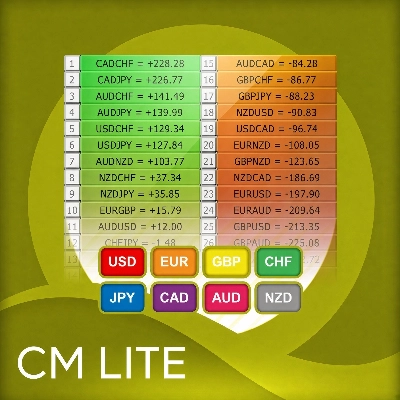
- Two-Column Ranking Ladder: Lists all 28 pairs in descending order (from green at the top to red at the bottom) alongside a second column displaying possible reversals from potentially overbought (OB / [OB]) or from potentially oversold (OS / [OS]) momentum badges aligned with each pair's directional slope.
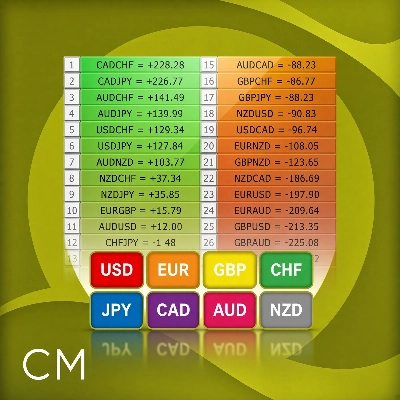
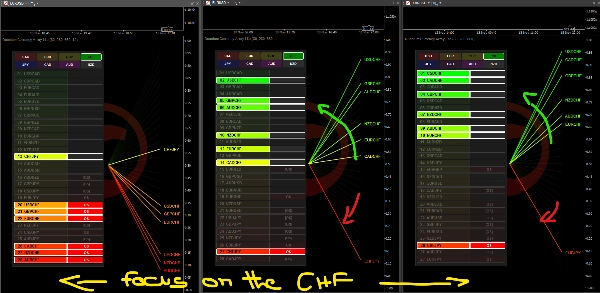
- Interactive Currency Filter Buttons: Eight filter buttons (USD, EUR, GBP, CHF, JPY, CAD, AUD, NZD) allow analysts to isolate every pair containing a chosen currency, highlighting both its ladder rows and fan rays while dimming unrelated pairs.
Key Settings & Parameters
- Max Look Back (Bars): Sets the number of historical bars used for both the linear regression slope and the synchronised RSI momentum engine (Default: 80 bars).
- Panel Width & Height (px): Adjusts the pixel dimensions of the dashboard panel to suit different monitor resolutions and DPI scaling settings (Default: 280 x 660 px).
- Text Font Size: Controls the text size of the pair labels and badge indicators inside the grid (Default: 12).
Typical Use Cases & Multi-Timeframe Analysis
We always advise traders to run the indicator across multiple chart timeframes side by side to observe whether currency strength or weakness on faster intervals aligns with broader structural trends on higher intervals. Isolating a single currency pair immediately shows whether all pairs in that complex are moving together or whether an individual pair is diverging due to localised market events.
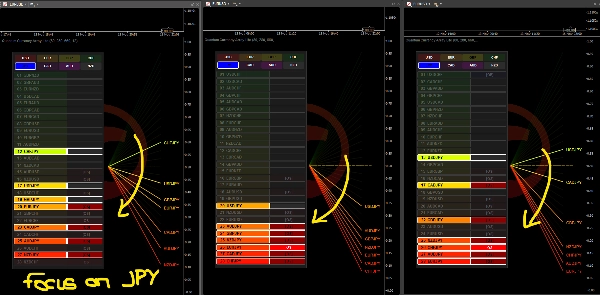
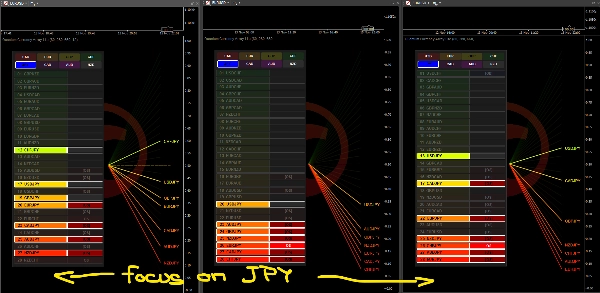
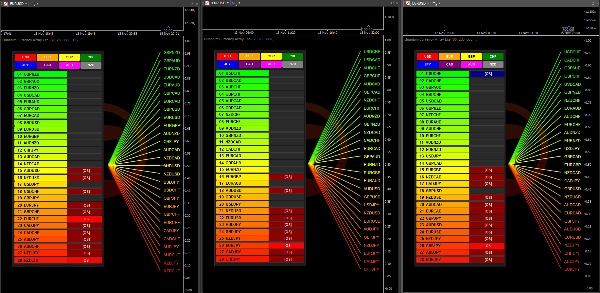
Traders typically display this indicator across three intraday timeframes simultaneously (1m, 5m, and 10m) to observe how momentum shifts develop on the fastest interval and ripple across slightly slower intervals.
Important Limitations & Operational Notes
- Not a Standalone System: This indicator displays historical linear regression slopes and momentum states; it does not generate automated trade entry or exit signals.
- Methodology Integration Required: This tool must always be used in conjunction with other technical analysis methodologies. Combining currency array data with Volume Price Analysis (VPA), key support and resistance levels, and price action is essential to validate market conditions before making trading decisions.
- Lite Edition Scope: This free version is restricted to the 1m, 5m, and 10m timeframes. Analysts requiring higher timeframes (such as 15m, 1h, 4h, or Daily) should use the full Quantum Currency Array indicator.
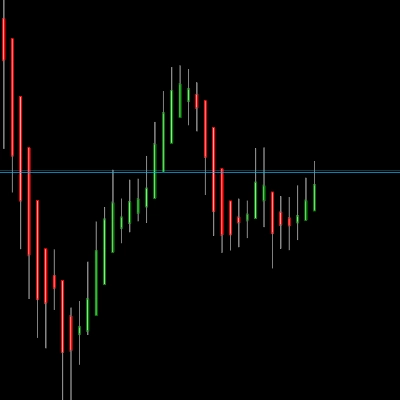
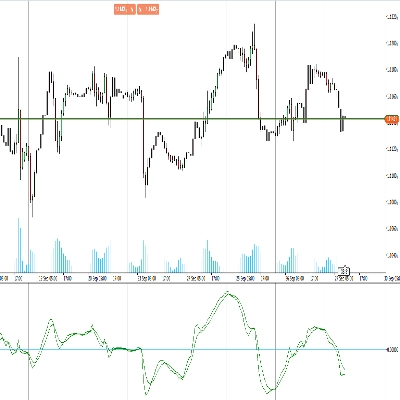
- Multiple timeframes: We always urge traders to use the indicator on at least three timeframes, as shown in the images below.
Özet
The indicator features a visual regression fan that displays color-graded rays representing the relative slope of each currency pair, and a two-column ranking ladder that orders pairs by strength and highlights possible overbought or oversold reversal signals using momentum badges. Interactive filter buttons allow users to isolate pairs containing specific currencies, enhancing focused analysis.
Key adjustable settings include lookback period, panel dimensions, and text font size. The tool is intended to be used alongside other technical analysis methods such as Volume Price Analysis, support and resistance levels, and price action. It does not generate automated trade signals and is recommended for use across multiple timeframes simultaneously to observe momentum shifts and trend alignment.
This Lite edition is limited to short intraday intervals; users requiring higher timeframes should consider the full Quantum Currency Array indicator.