Description
Présentation de l’Histogramme MACD amélioré, conçu pour offrir une expérience de trading plus claire et plus instructive.
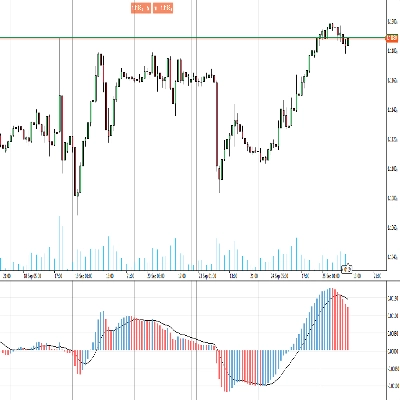
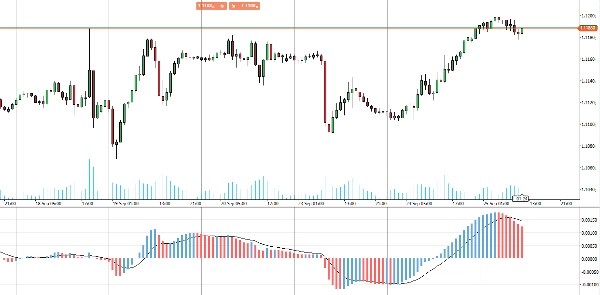
Cet indicateur amélioré affiche un histogramme coloré et dynamique qui différencie les variations de prix haussières et baissières, dépassant le format monochrome par défaut. En utilisant des couleurs distinctes pour les mouvements positifs et négatifs, il offre un indice visuel immédiat des conditions du marché, facilitant l’interprétation des changements de momentum et des retournements de tendance potentiels.
Parfait pour les traders recherchant une meilleure clarté et précision, cette mise à jour de l’Histogramme MACD transforme votre graphique en un outil d’analyse plus puissant. Élevez votre stratégie de trading avec l’Histogramme MACD amélioré.


