MultiMAIndicator_Optimized
Wskaźnik
1 zakupy
Wersja 1.0, Jun 2025
Windows, Mac
4.0
Opinie: 4
Opis
Konfiguracja wielo wskaźników
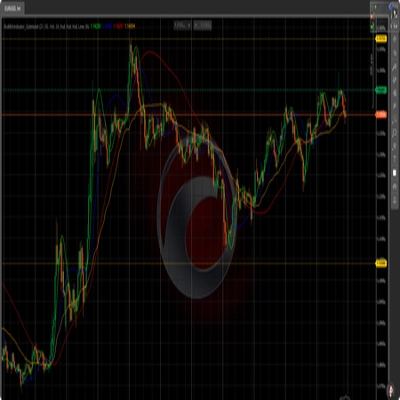
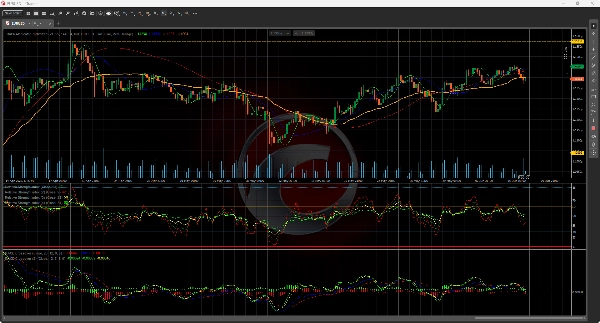
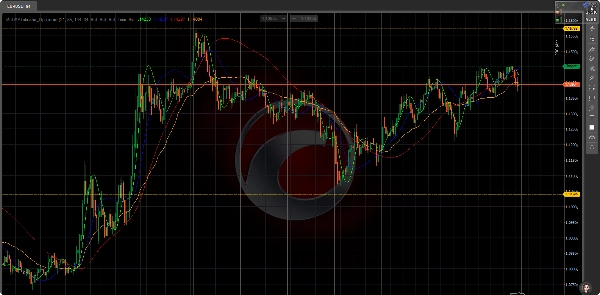
Główny wykres
Wyświetla 3 wykładnicze średnie kroczące Hull (HMA) oraz 1 ważoną wolumenem średnią kroczącą (VWMA)
Pierwszy wykres podrzędny
Pokazuje wskaźnik RSI z poziomami wykupienia/wyprzedania (progi 70/30)
Drugi wykres podrzędny
Wyświetla wskaźnik MACD wraz z linią sygnału i histogramem
Kluczowa terminologia
Wykładnicza średnia krocząca Hull (HMA):
Zaawansowana średnia krocząca minimalizująca opóźnienie poprzez ważone obliczenia cen
Ważona wolumenem średnia krocząca (VWMA):
Wskaźnik potwierdzający cenę ważony wolumenem obrotu
Poziomy wykupienia/wyprzedania:
Standardowe progi RSI (70 = wykupienie, 30 = wyprzedanie)
Histogram MACD:
Wizualna reprezentacja dywergencji/zbieżności momentum
Podsumowanie
Profil wskaźnika
Opinie klientów
4.0
Opinie: 4
5 | 25 % | |
4 | 50 % | |
3 | 25 % | |
2 | 0 % | |
1 | 0 % |
Opinie klientów
June 23, 2025
pretty decent as a helper. Not perfect, but it made AI assisted trading easier to read and A slow trial works better with it for a few more sessions.
June 22, 2025
tested like a normal trader would, small size first. The idea is fine, but it is not worth trying to scale it before seeing how it handles bad days. Manual review still matters here.
June 21, 2025
This fits AI assisted trading better as a review layer. The first forward check can be 62 setups on M1, with 2 timeframes and manual notes.
June 17, 2025
feels right for a user who wants less noise in the process. The best use is checking market bias, then leaving the final filter manual. Better rechecked it on 30 days.
Dyskusja
Częste pytania
Signal
RSI
MACD
Produkty dostępne za pośrednictwem cTrader Store, w tym boty handlowe, wskaźniki i wtyczki, dostarczane są przez deweloperów zewnętrznych i udostępniane wyłącznie w celach informacyjnych oraz w celu zapewnienia dostępu technicznego. cTrader Store nie jest brokerem i nie zapewnia doradztwa inwestycyjnego, nie udziela spersonalizowanych rekomendacji ani nie gwarantuje przyszłych wyników.
Możesz także polubić


Cena
Od 03/04/2025
1.71B
Wolumen transakcji
556.96K
Zysk w pipsach
1
Sprzedaż