Heatmap Volume Candles
Wskaźnik
1 zakupy
Wersja 1.0, Mar 2026
Windows, Mac
5.0
Opinie: 3
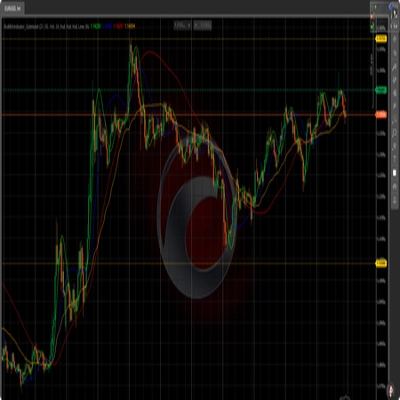
Trading product for Heatmap Volume Candles Wskaźnik BTCUSD Forex, image 2
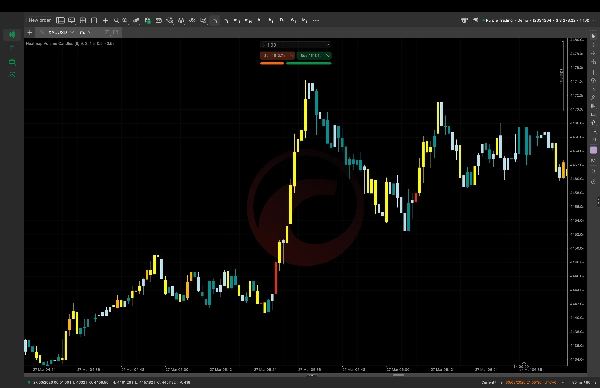
Trading product for Heatmap Volume Candles Wskaźnik BTCUSD Forex, image 3
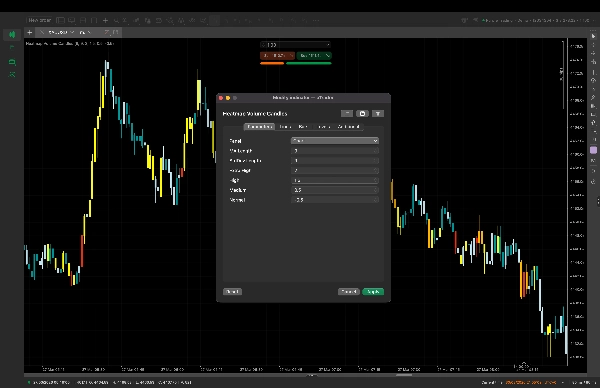
Trading product for Heatmap Volume Candles Wskaźnik BTCUSD Forex, image 4
Trading product for Heatmap Volume Candles Wskaźnik BTCUSD Forex, image 5
Od 04/03/2026
3
Sprzedaż

Opis

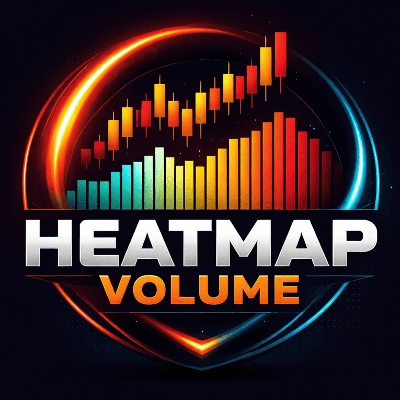
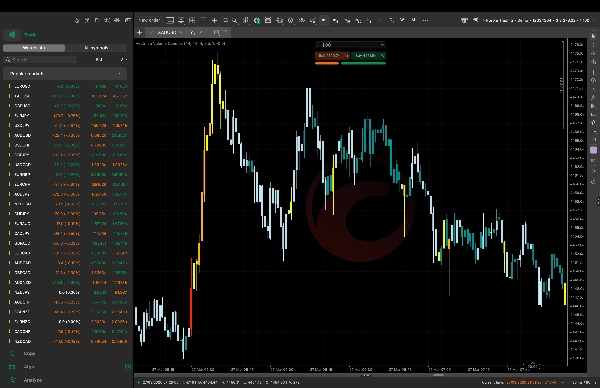
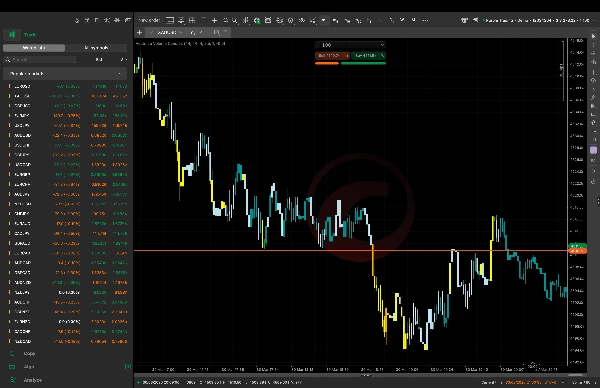
Heatmap Volume Candles to potężny wskaźnik, który przekształca twoje zwykłe świece w inteligentne sygnały oparte na wolumenie. Zamiast zwykłych zielonych i czerwonych świec, koloruje każdą świecę w zależności od siły wolumenu stojącego za ruchem — pomagając ci natychmiast zrozumieć, czy ruch jest silny, słaby, czy potencjalną pułapką.

Dzięki wykorzystaniu statystycznej analizy wolumenu (Z-score), wskaźnik podkreśla, kiedy wolumen jest niezwykle wysoki lub niski w porównaniu do średniej. Pozwala to wyraźnie zidentyfikować aktywność instytucjonalną, silny impet oraz fałszywe wybicia. Świece o wysokim wolumenie (czerwone, pomarańczowe, żółte) sygnalizują silny udział i kontynuację trendu, podczas gdy świece o niskim wolumenie (niebieskie, morski) ostrzegają przed słabymi ruchami i bocznymi warunkami rynkowymi.

Czyni to wskaźnik niezwykle użytecznym do skalpowania i handlu intraday, gdzie czas i precyzja są wszystkim. Nie musisz już zgadywać, czy wybicie jest prawdziwe — wystarczy spojrzeć na kolor świecy i handlować z pewnością.

🔥 Kluczowe korzyści:

  • Natychmiast zobacz siłę wolumenu bezpośrednio na świecach
  • Zidentyfikuj aktywność smart money (instytucjonalną)
  • Potwierdź prawdziwe wybicia i silne trendy
  • Unikaj fałszywych ruchów i pułapek niskiego wolumenu
  • Łatwo filtruj rynki boczne (zakresowe)
  • Poprawiaj timing wejścia i precyzję handlu
  • Działa doskonale ze strategiami opartymi na EMA (np. EMA 44)
  • Czysty, wizualny i łatwy w użyciu dla wszystkich traderów

Heatmap Volume Candles daje ci znaczącą przewagę, łącząc analizę cen z inteligencją wolumenu — dzięki czemu możesz handlować tylko wtedy, gdy rynek naprawdę ma za sobą siłę.

Podsumowanie

Podsumowanie AI
Heatmap Volume Candles is a volume-based trading indicator that colors price candles according to the strength of volume behind each move. Using statistical volume analysis (Z-score), it highlights unusually high or low volume relative to average levels, enabling traders to identify institutional activity, strong momentum, and potential fake breakouts. High-volume candles are displayed in warm colors (red, orange, yellow) indicating strong participation and trend continuation, while low-volume candles appear in cool colors (blue, teal) signaling weak moves or sideways market conditions. This visual approach helps confirm real breakouts, avoid traps, and improve entry timing, making it suitable for scalping and intraday trading. The indicator integrates well with EMA-based strategies and supports multiple markets including Forex, cryptocurrencies, stocks, indices, and commodities. It provides a clear, easy-to-interpret volume overlay directly on price candles, enhancing trade precision by combining price action with volume intelligence.
Profil wskaźnika
Kategoria wskaźnika
Wolumen
Typ wyjścia
Wizualizacja
Filtr
Wymagania dotyczące danych
Wolumen
Obsługiwane sygnały
Przełamanie
Siła trendu
Zmienność

Opinie klientów

5.0
Opinie: 3
5
100 %
4
0 %
3
0 %
2
0 %
1
0 %
Opinie klientów
April 8, 2026
Ngl, this one makes sense if you are not trying to yolo every signal. Better keeping it on demo first and see how it behaves when liquidity moves gets messy.
April 2, 2026
pretty decent as a helper. Not perfect, but it made smart money style analysis easier to read and The first test can cover it for a few more sessions. Starting light makes the first result easier to trust.
April 1, 2026
the product feels practical for smart money style analysis if the trader keeps control. A 34 setup sample on M5 should show whether it really helps.

Dyskusja

Częste pytania

BTCUSD
Forex
Breakout
Indices
EURUSD
Commodities
GBPUSD
NZDUSD
Prop
Scalping
SMC
Crypto
Stocks
XAUUSD
NAS100
USDJPY
Produkty dostępne za pośrednictwem cTrader Store, w tym boty handlowe, wskaźniki i wtyczki, dostarczane są przez deweloperów zewnętrznych i udostępniane wyłącznie w celach informacyjnych oraz w celu zapewnienia dostępu technicznego. cTrader Store nie jest brokerem i nie zapewnia doradztwa inwestycyjnego, nie udziela spersonalizowanych rekomendacji ani nie gwarantuje przyszłych wyników.

Więcej od tego autora

Wskaźnik
RSI
SMC
+17
Turn WaveTrend Cross into a BTC profit machine precise buy sell signals, smart momentum edge, no lag trading system
Wskaźnik
SMC
Forex
+5
Detects Break of Structure (BOS) and Change of Character (CHOCH)
Wskaźnik
SMC
Prop
+16
Auto support-resistance + buy/sell signals! Catch breakouts early & never miss high-probability trades again 🚀📈
Wskaźnik
ATR
RSI
+17
🔥 Smart candles + Buy/Sell arrows! Catch trends, avoid sideways, and trade with precision like a pro!
Wskaźnik
SMC
Prop
+14
Heatmap Volume indicator: detect institutional activity, filter fake moves, and confirm high-probability trades fast.
Wskaźnik
Prop
Forex
+11
Advanced EMA indicator with dynamic color trend, slope strength & smart filters for clean, high-probability trading sign

Możesz także polubić

Wskaźnik
EMA
Moving Average
+1
A dual adaptive-moving-average trend indicator with slope confirmation
Wskaźnik
ATR
EMA
+5
All 11 timeframes, signal scores, trade calculator & price levels in one dashboard. Stop switching charts. Enjoy 1 chart
Wskaźnik
BOS
CHOCH
+5
Non-repainting market-structure overlay: liquidity, BOS/CHoCH, contraction zones, HTF bias + machine-readable data outpu
Wskaźnik
RSI
MACD
+1
​EURUSD H4
Wskaźnik
ATR
Supertrend
+5
Read price differently. Measure what the market actually does.
Wskaźnik
EMA
Channel
+2
Four Markets. One Decision. Gold, Nasdaq100, S&P500 & US30.

Cena

Od 04/03/2026
3
Sprzedaż