


Descrizione
🔥 Indicatore Dinamico di Supporto e Resistenza (Con Segnali Intelligenti)
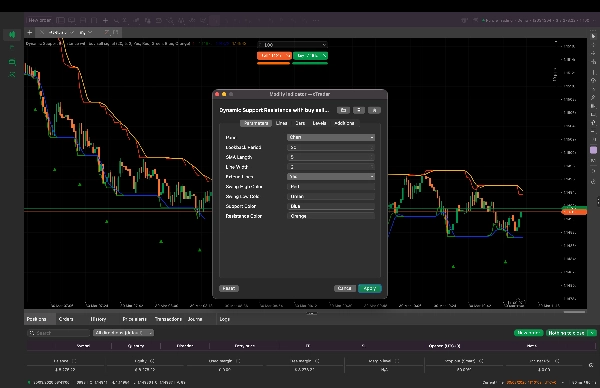
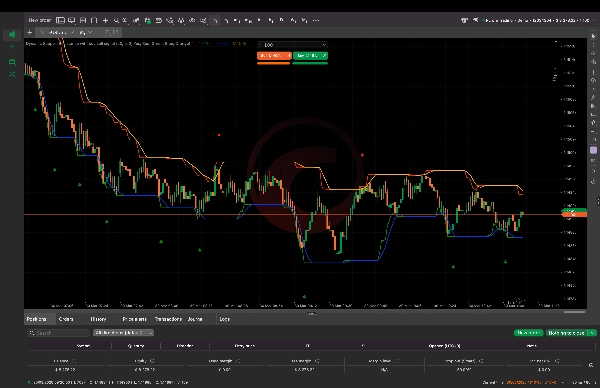
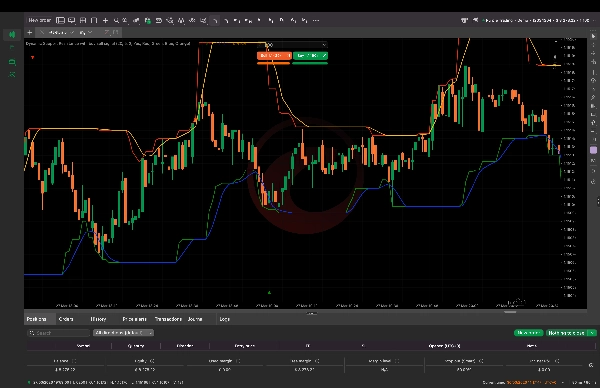
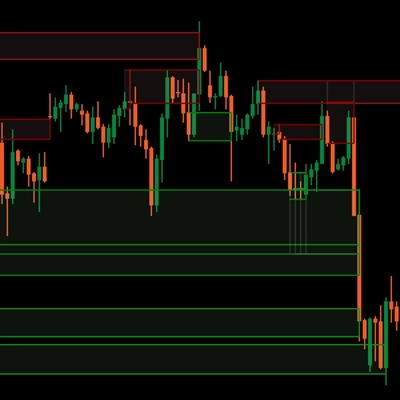
Questo indicatore avanzato è progettato per rilevare automaticamente livelli chiave della struttura di mercato e generare segnali di trading ad alta probabilità basati sull'azione del prezzo in tempo reale.
Calcola dinamicamente zone di supporto e resistenza utilizzando i recenti massimi e minimi oscillanti, quindi le smussa usando medie mobili per fornire livelli puliti e affidabili che si adattano alle condizioni di mercato in evoluzione.
📊 Cosa Analizza Questo Indicatore
- Recenti massimi e minimi oscillanti utilizzando un periodo di lookback personalizzabile
- Cambiamenti nella struttura di mercato e zone di prezzo dinamiche
- Livelli di supporto e resistenza smussati (basati su SMA)
- Interazione del prezzo con livelli chiave (breakout e rifiuti)
🎯 Logica del Segnale (Come Usarlo)
✅ Segnale di Acquisto
- Il prezzo supera il supporto dinamico
- La candela precedente era sotto il supporto
👉 Indica una potenziale inversione o continuazione rialzista
❌ Segnale di Vendita
- Il prezzo rompe al di sotto della resistenza dinamica
- La candela precedente era sopra la resistenza
👉 Indica un potenziale movimento ribassista
Tutti i segnali sono tracciati direttamente sul grafico utilizzando frecce visive chiare, rendendo l'esecuzione veloce e semplice.
⚙️ Caratteristiche Principali
- 📈 Rilevamento automatico di supporto e resistenza
- 🔄 Livelli dinamici che si adattano alle condizioni di mercato
- 🎯 Segnali integrati di acquisto e vendita
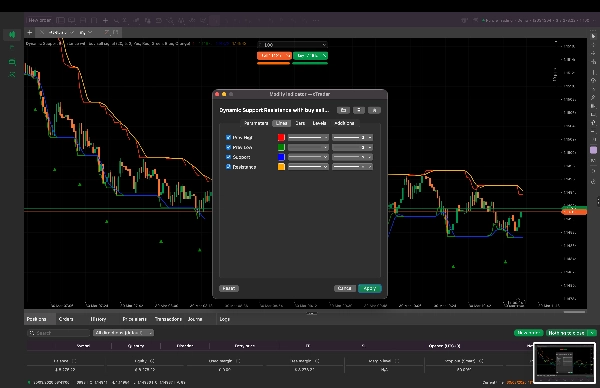
- 🎨 Colori e spessore delle linee completamente personalizzabili
- ⏱ Funziona su tutti i timeframe (da M1 a TF superiori)
- 🚀 Ideale per scalping, intraday e swing trading
- 📊 Grafico pulito – nessun ingombro, solo dati utilizzabili
⚙️ Impostazioni Importanti
- Periodo di Lookback → Controlla la sensibilità del rilevamento degli swing
- Lunghezza SMA → Smussatura di supporto/resistenza
- Spessore e Colori delle Linee → Personalizzazione visiva
- Estendi Linee → Proietta i livelli nel futuro
💡 Migliori Casi d'Uso
- Catturare breakout precoci
- Identificare forti zone di inversione
- Fare trading su rimbalzi di supporto e rifiuti di resistenza
- Combinare con EMA / RSI / Volume per conferme
👤 Chi Dovrebbe Usarlo?
- Trader principianti in cerca di guida chiara sulla struttura
- Trader intermedi che vogliono ingressi basati su regole
- Trader avanzati che lo usano come strumento di congiunzione
⚠️ Note Importanti
- Questo è uno strumento di supporto alle decisioni, non un sistema di profitto garantito
- Funziona meglio se combinato con una corretta gestione del rischio
- Evitare di usare i segnali ciecamente durante eventi di notizie ad alto impatto
Riepilogo
Key features include automatic detection of support and resistance, dynamic level adjustments, built-in buy and sell signals, and full customization of colors and line thickness. It functions across all timeframes from one minute upwards and suits scalping, intraday, and swing trading styles. The indicator is designed for traders of all experience levels, offering clear structure guidance, rule-based entries, and confluence support. Important settings allow control over swing detection sensitivity, smoothing, and visual presentation. It is recommended to use this tool alongside proper risk management and avoid relying on signals during high-impact news events.
Supported markets include Forex, cryptocurrencies, stocks, indices, and commodities.
Recensioni dei clienti
5 | 50 % | |
4 | 50 % | |
3 | 0 % | |
2 | 0 % | |
1 | 0 % |
Discussioni
Domande frequenti
Altro da questo autore





Potrebbe interessarti anche










Prezzo