"Heatmap Volume Candles" logo
Indicator
Version 1.0, Mar 2026
Windows, Mac
5.0
Reviews: 3
"Heatmap Volume Candles" uploaded image
Since 04/03/2026
1
Sales

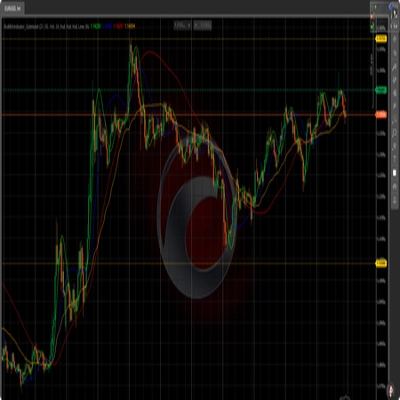
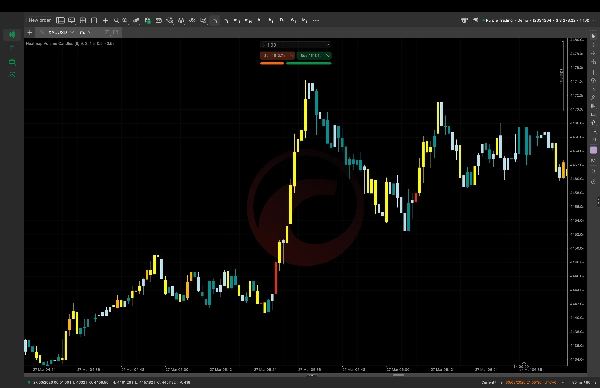
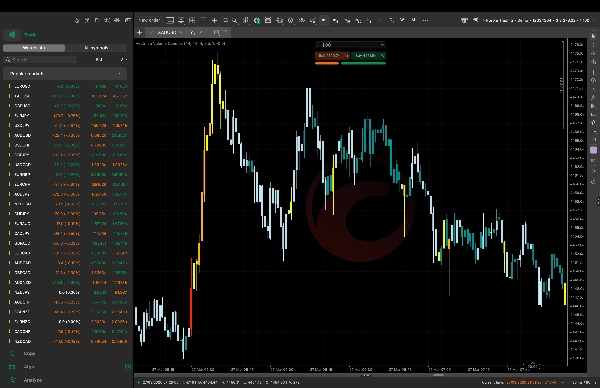
Heatmap Volume Candles is a powerful indicator that transforms your regular candles into smart, volume-driven signals. Instead of plain green and red candles, it colors each candle based on the strength of volume behind the move—helping you instantly understand whether a move is strong, weak, or a potential trap.

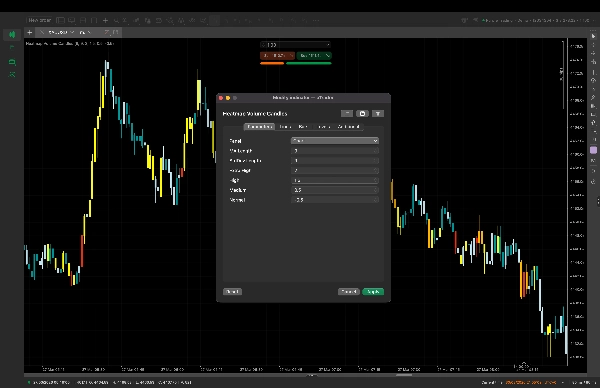
By using statistical volume analysis (Z-score), the indicator highlights when volume is unusually high or low compared to its average. This allows you to clearly identify institutional activity, strong momentum, and fake breakouts. High-volume candles (red, orange, yellow) signal strong participation and trend continuation, while low-volume candles (blue, teal) warn you about weak moves and sideways market conditions.

This makes it extremely useful for scalping and intraday trading, where timing and accuracy are everything. You no longer have to guess whether a breakout is real—just look at the candle color and trade with confidence.

🔥 Key Benefits:

  • Instantly see volume strength directly on candles
  • Identify smart money (institutional) activity
  • Confirm real breakouts and strong trends
  • Avoid fake moves and low-volume traps
  • Filter sideways (range-bound) markets easily
  • Improve entry timing and trade precision
  • Works perfectly with EMA-based strategies (like EMA 44)
  • Clean, visual, and easy to use for all traders

Heatmap Volume Candles gives you a major edge by combining price action with volume intelligence—so you can trade only when the market truly has strength behind it.

Indicator profile
Indicator category
Volume
Output type
Visualisation
Filter
Data requirements
Volume
Supported signals
Breakout
Trend strength
Volatility
5.0
Reviews: 3
5
100 %
4
0 %
3
0 %
2
0 %
1
0 %
Customer reviews
April 8, 2026
Ngl, this one makes sense if you are not trying to yolo every signal. Better keeping it on demo first and see how it behaves when liquidity moves gets messy.
April 2, 2026
pretty decent as a helper. Not perfect, but it made smart money style analysis easier to read and The first test can cover it for a few more sessions. Starting light makes the first result easier to trust.
April 1, 2026
the product feels practical for smart money style analysis if the trader keeps control. A 34 setup sample on M5 should show whether it really helps.
BTCUSD
Forex
Breakout
Indices
EURUSD
Commodities
GBPUSD
NZDUSD
Prop
Scalping
SMC
Crypto
Stocks
XAUUSD
NAS100
USDJPY
Products available through cTrader Store, including trading bots, indicators and plugins, are provided by third-party developers and made available for informational and technical access purposes only. cTrader Store is not a broker and does not provide investment advice, personal recommendations or any guarantee of future performance.

More from this author

Indicator
SMC
Forex
+5
Detects Break of Structure (BOS) and Change of Character (CHOCH)
Indicator
SMC
Prop
+16
Auto support-resistance + buy/sell signals! Catch breakouts early & never miss high-probability trades again 🚀📈
Indicator
ATR
RSI
+17
🔥 Smart candles + Buy/Sell arrows! Catch trends, avoid sideways, and trade with precision like a pro!
Indicator
SMC
Prop
+14
Heatmap Volume indicator: detect institutional activity, filter fake moves, and confirm high-probability trades fast.
Indicator
RSI
SMC
+17
Turn WaveTrend Cross into a BTC profit machine precise buy sell signals, smart momentum edge, no lag trading system
Indicator
Prop
Forex
+11
Advanced EMA indicator with dynamic color trend, slope strength & smart filters for clean, high-probability trading sign

You may also like

Indicator
RSI
MACD
+1
​EURUSD H4
Since 04/03/2026
1
Sales