

Description
- MiniBull MTF Observer
- One indicator. Every timeframe. Zero chart switching.
- SHORT DESCRIPTION
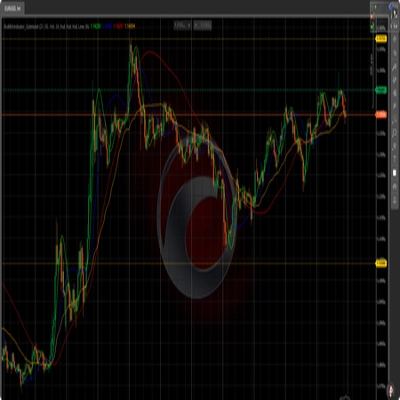
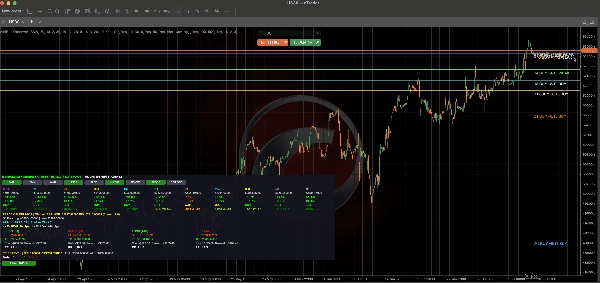
- See 11 timeframes, a composite signal score, a built-in trade calculator, and key price-level analytics - all from a single, toggleable dashboard on your chart.
- FULL DESCRIPTION
- MiniBull MTF Observer is a multi-timeframe market analysis dashboard built for traders who don't want to jump between charts to get the full picture.
- Instead of flipping through M1, M5, M15, M30, H1, H4, H8, H12, D1, W1, and MN1 one by one, MiniBull calculates and displays all 11 timeframes at once - moving average position, trend direction, and a weighted composite score - in one compact, collapsible dashboard.
- - Multi-Timeframe Overview
- Instantly see whether price is above or below its moving average on every timeframe from M1 to Monthly, with distance in pips and percentage, and a clear BUY / SELL / WAIT signal for each.
- - Composite Signal Score (0-13)
- Each timeframe gets a weighted score combining RSI, MACD, Stochastic, CCI, Momentum, and multiple MA crossovers (SMA5, SMA20, EMA21, EMA50) - so you can gauge signal strength at a glance instead of reading five separate indicators.
- - Choice of Moving Average
- Switch between SMA, EMA, and KAMA (Kaufman's Adaptive Moving Average) directly from the dashboard buttons - no need to reopen settings.
- - Built-in Trade Calculator
- Automatically computes SL/TP levels and risk/reward for both Long and Short setups using two methods side by side:
- - Previous D1 High/Low levels
- - ATR-based stops (Wilder's ATR, configurable multipliers)
- - Price Level Analysis
- Tracks how many times price has tested the current level historically, how often it broke up vs. down, and flags All-Time-High / All-Time-Low / First-Time-At-Level conditions - giving you context before you enter a trade.
- - D1 Level Alerts
- Get notified (sound and/or email) when price approaches or breaks the previous day's high/low, and when a timeframe flips into a strong buy/sell zone.
- - Clean, Collapsible Dashboard
- The dashboard sits quietly in the bottom-left corner and starts closed by default - click the toggle button whenever you want the full breakdown. MA lines stay plotted on the chart at all times, independent of the dashboard state, so your chart never loses context.
- - Fully Customizable
- Adjust MA/RSI/MACD/Stochastic/CCI/Momentum periods, ATR multipliers, alert ranges, colors, font size, and panel position to match your own trading style.
- WHY TRADERS USE MINIBULL
- - Stop switching between chart windows to check higher/lower timeframes
- - Spot alignment (or conflict) across timeframes in seconds
- - Get objective SL/TP suggestions instead of guessing
- - Know instantly if you're trading near a historically significant level
- Works on any symbol and any chart timeframe.
Summary
Indicator profile
Indicator category
Trend
Output type
Visualisation
Data requirements
Bars only
Supported signals
Trend strength
Session opening range
Breakout
Level break
Level touch
Volatility
Reversal
Divergence
Cross
Customer reviews
0.0
Reviews: 0
Customer reviews
No reviews for this product yet. Already tried it? Be the first to tell others!
Discussion
FAQ
Inside Bar
EMA
SMA
Key Levels
ATR
Moving Average
Support & Resistance
Products available through cTrader Store, including trading bots, indicators and plugins, are provided by third-party developers and made available for informational and technical access purposes only. cTrader Store is not a broker and does not provide investment advice, personal recommendations or any guarantee of future performance.