

Description
Promotional pricing: $697 Take your Chance. The price returns to $897 after a set number of downloaded APEX copies.
APEX MARKET STRUCTURE PRO (Agent Version)
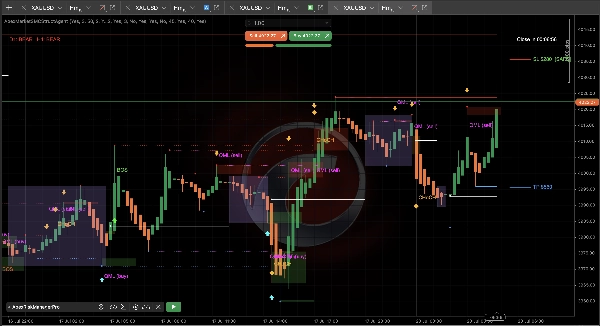
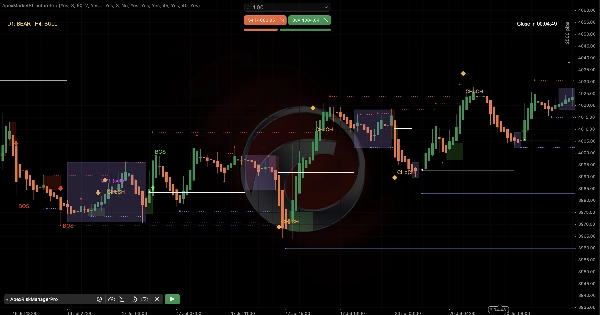
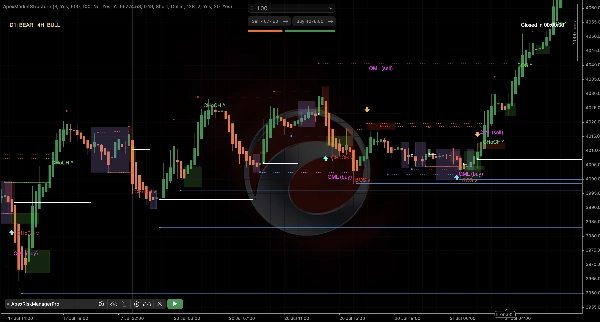
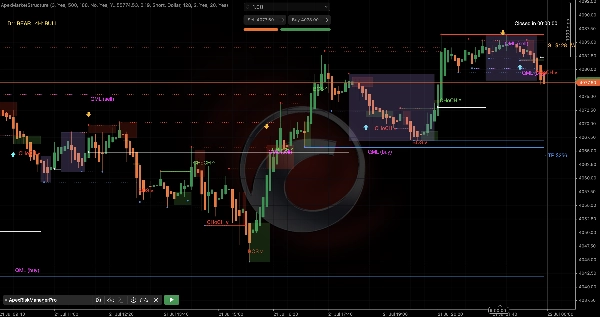
A precision market-structure overlay for cTrader that maps the mechanics of price, liquidity, structure shifts, and contraction on one clean, non-repainting chart. The Pro edition additionally exposes every structural reading as machine-readable data outputs for algorithmic and agent integration via the cAlgo API.
Indicator only: it draws structure and exposes it as machine-readable data.
The indicator itself never places orders. Its data outputs can feed an external automated system or agent, (Claude via MCP, or any cAlgo-API client) which executes independently through its own trading connection. Note that execution is the operator's responsibility, not the indicator's.
WHAT IT ANALYSES
Apex Market Structure Pro reads raw price action on any instrument and any timeframe. It identifies:
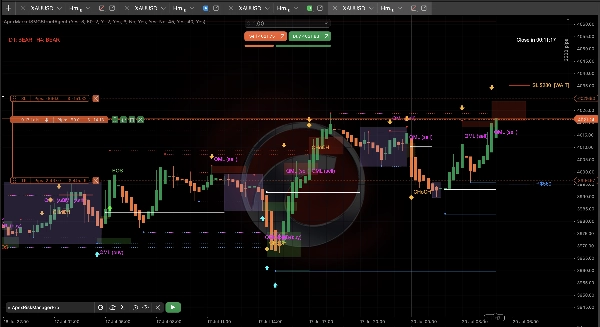
- Liquidity levels: Swing highs and lows that act as stop pools. Unswept levels project forward; swept levels freeze and turn dotted, marking consumed liquidity.
- Market structure: Break of Structure (BOS, continuation) and Change of Character (CHoCH, reversal), each confirmed only on a closed-bar close.
- Contraction zones: filled zones marking volatility compression (accumulation) via an ATR-ratio test, with a mid-price value line.
- Higher-timeframe bias: Daily and 4H EMA trend, read from the last closed HTF bar (no lookahead, no intraday repaint).
- Pre-entry risk gauge: A visual SL/TP sizing tool that verdicts your stop against the nearest unswept liquidity: SAFE (stop sits beyond the level) or WAIT (stop short of it).
NON-REPAINTING BY DESIGN
Every persistent object: liquidity line, sweep, BOS/CHoCH label, entry arrow, contraction box, value line, is created only from a CLOSED bar, never the live forming candle. The chart is identical whether built live tick-by-tick or recalculated on reload. Signals appear one bar after the candle that produces them closes — the deliberate price of not repainting.
HOW TO READ IT
- Liquidity lines (red = sell-side/highs, blue = buy-side/lows) show where stops rest. A sweep of an unswept level often precedes a reversal.
- BOS confirms trend continuation; CHoCH warns of a potential reversal.
- Contraction zones mark compression and Expansion typically follows.
- The HTF bias panel (top-left) shows Daily/4H alignment. Trade the daily direction; use lower timeframes for timing.
- The risk gauge (right edge) is a hypothetical pre-entry check. Size your stop to clear the nearest liquidity before entering.
PRO — MACHINE-READABLE OUTPUTS
For algorithmic traders and custom automation, the Pro edition publishes its structural state as data series readable via the cAlgo API: HTF bias, market phase, ATR compression ratio, nearest unswept liquidity levels, BOS/CHoCH events, and the risk verdict. These outputs are transparent (the chart stays visually clean) and non-repainting on closed bars. Suitable for building your own decision-support tools and agent integrations on top of Apex's structure.
KEY SETTINGS
- Liquidity — swing strength, max lines, thickness
- Structure — minor/major swing strength (major defines the protected levels whose break is a CHoCH), max labels
- Contraction — ATR period, compression ratio, min bars, box opacity
- HTF bias — EMA period; entry arrows optionally bias-filtered (D1 / H4 / both)
- Risk gauge — balance, lot size, direction (Long/Short/Auto), risk mode (percent or dollar), reward:risk
- Alerts — new box, liquidity sweep, BOS/CHoCH, entry arrow (all optional, fire only on live closed bars)
- Agent: enable or disable the machine-readable data outputs. When enabled, an external agent (via the cAlgo API) can read the indicator's structural state to cross-check against your own analysis. The toggle controls data exposure only; any trade execution is performed by the external system through its own connection, at the operator's discretion..
BEST SUITED FOR
Discretionary and algorithmic traders who trade with market structure and smart-money concepts — reading liquidity, structure breaks, and higher-timeframe context. The visual layer serves manual traders of any experience level who want a clean structural read; the data outputs serve developers building automation on the cAlgo platform. Works on all instruments and timeframes; the full workflow is best experienced on Heikin Ashi candles.
LIMITATIONS & NOTES
- This is an indicator — it analyses and displays; it does not execute trades or provide financial advice.
- Signals confirm on closed bars, appearing one bar after the producing candle — by design, to guarantee non-repainting.
- The risk gauge is a visual sizing aid, not an order.
- Machine-readable outputs are read via the cAlgo API; integrating them into an automated system is the developer's responsibility.
Summary
The indicator provides a pre-entry risk gauge that visually assesses stop-loss placement relative to the nearest unswept liquidity level, indicating whether the stop is "SAFE" or requires "WAIT." It supports customization of liquidity detection, structure sensitivity, contraction parameters, EMA periods, risk sizing, and alert preferences.
The Pro edition uniquely exposes all structural readings as machine-readable data outputs accessible via the cAlgo API. This enables integration with external algorithmic trading systems or agents, which can independently execute trades based on the indicator’s data. The indicator itself does not place orders.
Apex Market Structure Pro is suitable for discretionary and algorithmic traders employing market structure and smart-money concepts across all instruments and timeframes. It is optimized for use with Heikin Ashi candles and supports building custom decision-support tools or automated strategies on the cAlgo platform.
Customer reviews
Discussion
FAQ
More from this author
You may also like

Price
