

Opis
- MiniBull MTF Observer
- Jeden wskaźnik. Każdy interwał czasowy. Zero przełączania wykresów.
- KRÓTKI OPIS
- Zobacz 11 interwałów czasowych, złożony wynik sygnału, wbudowany kalkulator transakcji oraz kluczową analizę poziomów cenowych - wszystko z jednego, przełączalnego panelu na Twoim wykresie.
- PEŁNY OPIS
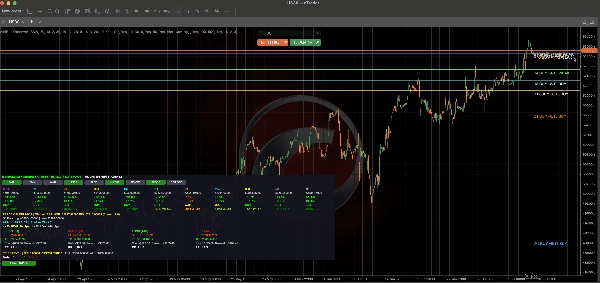
- MiniBull MTF Observer to panel analizy rynku wielointerwałowej stworzony dla traderów, którzy nie chcą przeskakiwać między wykresami, aby uzyskać pełny obraz.
- Zamiast przeglądać M1, M5, M15, M30, H1, H4, H8, H12, D1, W1 i MN1 jeden po drugim, MiniBull oblicza i wyświetla wszystkie 11 interwałów jednocześnie - pozycję średniej kroczącej, kierunek trendu oraz ważony wynik złożony - w jednym kompaktowym, zwijanym panelu.
- - Przegląd wielointerwałowy
- Natychmiast zobacz, czy cena jest powyżej czy poniżej swojej średniej kroczącej na każdym interwale od M1 do miesięcznego, z odległością w pipsach i procentach oraz wyraźnym sygnałem KUP / SPRZEDAJ / CZEKAJ dla każdego.
- - Złożony wynik sygnału (0-13)
- Każdy interwał otrzymuje ważony wynik łączący RSI, MACD, Stochastic, CCI, Momentum oraz wiele przecięć MA (SMA5, SMA20, EMA21, EMA50) - dzięki czemu możesz ocenić siłę sygnału na pierwszy rzut oka zamiast czytać pięć oddzielnych wskaźników.
- - Wybór średniej kroczącej
- Przełączaj się między SMA, EMA i KAMA (Kaufman Adaptive Moving Average) bezpośrednio z przycisków panelu - nie ma potrzeby ponownego otwierania ustawień.
- - Wbudowany kalkulator transakcji
- Automatycznie oblicza poziomy SL/TP oraz ryzyko/zysk dla ustawień Long i Short, korzystając z dwóch metod obok siebie:
- - Poprzednie poziomy D1 High/Low
- - Stop lossy oparte na ATR (ATR Wildera, konfigurowalne mnożniki)
- - Analiza poziomów cenowych
- Śledzi, ile razy cena testowała dany poziom historycznie, jak często przebijała go w górę vs. w dół, oraz oznacza warunki All-Time-High / All-Time-Low / Pierwszy raz na poziomie - dając Ci kontekst przed wejściem w transakcję.
- - Alerty poziomów D1
- Otrzymuj powiadomienia (dźwiękowe i/lub e-mail) gdy cena zbliża się do lub przebija poprzedni dzienny szczyt/dno oraz gdy interwał przełącza się w silną strefę kupna/sprzedaży.
- - Czysty, zwijany panel
- Panel znajduje się spokojnie w lewym dolnym rogu i domyślnie jest zamknięty - kliknij przycisk przełączania, gdy chcesz zobaczyć pełne zestawienie. Linie MA pozostają zawsze narysowane na wykresie, niezależnie od stanu panelu, więc Twój wykres nigdy nie traci kontekstu.
- - W pełni konfigurowalny
- Dostosuj okresy MA/RSI/MACD/Stochastic/CCI/Momentum, mnożniki ATR, zakresy alertów, kolory, rozmiar czcionki i pozycję panelu, aby dopasować do własnego stylu handlu.
- DLACZEGO TRADERZY UŻYWAJĄ MINIBULL
- - Przestań przełączać się między oknami wykresów, aby sprawdzać wyższe/niższe interwały
- - Wykrywaj zgodność (lub konflikt) między interwałami w kilka sekund
- - Otrzymuj obiektywne sugestie SL/TP zamiast zgadywać
- - Natychmiast wiesz, czy handlujesz blisko historycznie istotnego poziomu
- Działa na dowolnym symbolu i dowolnym interwale wykresu.
Podsumowanie
Profil wskaźnika
Kategoria wskaźnika
Trend
Typ wyjścia
Wizualizacja
Wymagania dotyczące danych
Tylko słupki
Obsługiwane sygnały
Siła trendu
Zakres otwarcia sesji
Przełamanie
Przebicie poziomu
Dotknięcie poziomu
Zmienność
Odwrócenie trendu
Dywergencja
Przecięcie
Opinie klientów
0.0
Opinie: 0
Opinie klientów
Ten produkt nie ma jeszcze opinii. Wypróbowałeś(-aś) go już? Bądź pierwszy(-a) i powiedz o tym innym!
Dyskusja
Częste pytania
Inside Bar
EMA
SMA
Key Levels
ATR
Moving Average
Support & Resistance
Produkty dostępne za pośrednictwem cTrader Store, w tym boty handlowe, wskaźniki i wtyczki, dostarczane są przez deweloperów zewnętrznych i udostępniane wyłącznie w celach informacyjnych oraz w celu zapewnienia dostępu technicznego. cTrader Store nie jest brokerem i nie zapewnia doradztwa inwestycyjnego, nie udziela spersonalizowanych rekomendacji ani nie gwarantuje przyszłych wyników.