
50 percent
Wskaźnik
Wersja 1.0, Aug 2025
Windows, Mac
5.0
Opinie: 2

Opis
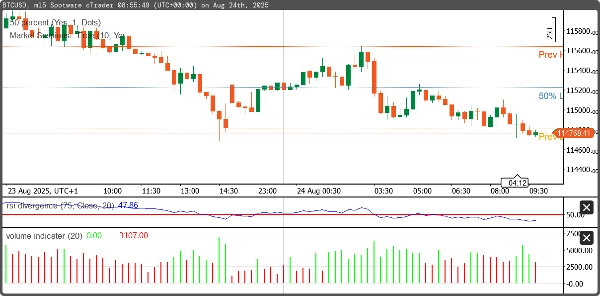
Ten cBot automatycznie wykrywa najwyższe i najniższe ceny z poprzedniej sesji oraz oblicza punkt środkowy między nimi. Został zaprojektowany, aby pomagać traderom poprzez identyfikację kluczowych stref wsparcia/oporu oraz poziomów równowagi rynkowej, które często są wykorzystywane w strategiach odwrócenia lub wybicia.
- Wykrywa najwyższy i najniższy punkt z poprzedniego dnia (lub sesji).
- Oblicza punkt środkowy między najwyższym a najniższym punktem.
- Rysuje na wykresie poziomy najwyższego, najniższego i punktu środkowego.
Podsumowanie
Profil wskaźnika
Opinie klientów
5.0
Opinie: 2
5 | 100 % | |
4 | 0 % | |
3 | 0 % | |
2 | 0 % | |
1 | 0 % |
Opinie klientów
August 29, 2025
The screen feels less crowded, but the final call still needs say no.
August 20, 2025
Dyskusja
Częste pytania
Produkty dostępne za pośrednictwem cTrader Store, w tym boty handlowe, wskaźniki i wtyczki, dostarczane są przez deweloperów zewnętrznych i udostępniane wyłącznie w celach informacyjnych oraz w celu zapewnienia dostępu technicznego. cTrader Store nie jest brokerem i nie zapewnia doradztwa inwestycyjnego, nie udziela spersonalizowanych rekomendacji ani nie gwarantuje przyszłych wyników.
Więcej od tego autora


Cena
Od 14/05/2025
10.1M
Wolumen transakcji
81.44K
Zysk w pipsach
201
Bezpłatne instalacje