설명
FedPulse - cTrader용 연준 정책 분석 플러그인
═══════════════════════════════════════════════════
유형: 데스크탑 플러그인 | 플랫폼: cTrader | 접근 권한: 없음
FEDPULSE란?
─────────────────
CME FedWatch, 재무부 웹사이트, ETF 페이지를 번갈아 가며 확인하지 마세요.
FedPulse는 연준 정책과 귀금속 분석에 필요한 모든 것을
하나의 통합된 cTrader 패널로 제공합니다.
✓ 실시간 CME FedWatch 금리 기대치
✓ DXY 및 재무부 수익률 곡선 모니터링
✓ ETF 보유 추적 (GLD, IAU, SLV)
✓ COMEX 창고 재고 데이터
✓ 통계 분석이 포함된 금/은 비율
거래 플랫폼을 떠나지 않고도 연준 정책 변화를 앞서가고자 하는 금속 및 FX 트레이더를 위해 제작되었습니다.
→ 모든 기능을 탐색하려면 무료 7일 체험판을 사용해 보세요.
누가 FEDPULSE를 사용해야 하나요?
────────────────────────
• 거시적 펀더멘털을 모니터링하는 금/은 트레이더
• USD 정책 방향을 추적하는 FX 트레이더
• FOMC 이벤트 주변에서 진입 타이밍을 잡는 스윙 트레이더
• 공급 측 데이터를 분석하는 포지션 트레이더
• CME FedWatch를 정기적으로 확인하는 모든 사람
패널 모듈
─────────────
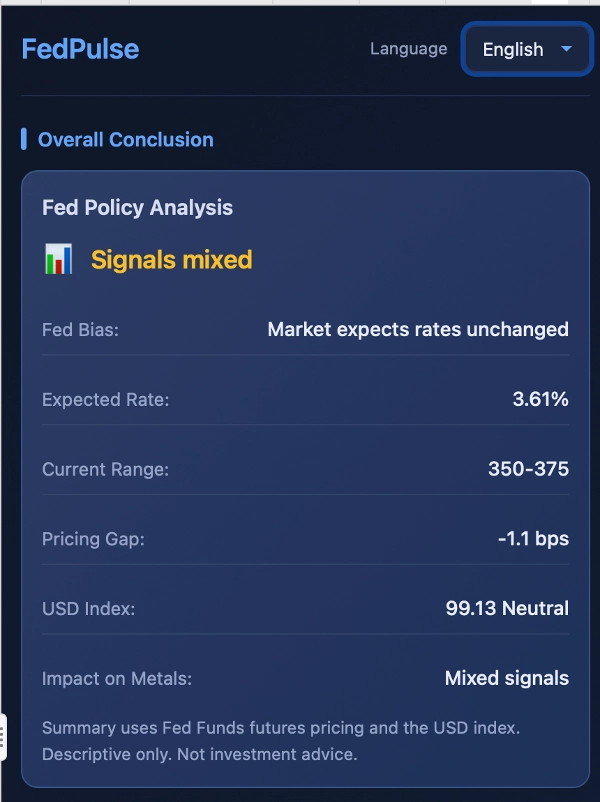
1. 전체 결론
주요 연준 정책 입장을 한눈에 보여주는 빠른 요약 대시보드.
표시: 연준 편향, 예상 금리, 현재 범위, 가격 격차, DXY,
금속에 미치는 영향
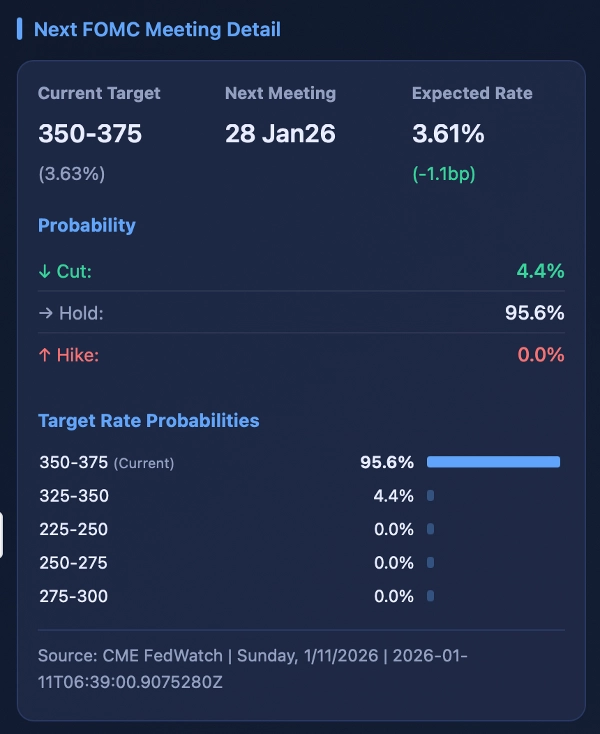
2. CME FedWatch - 다음 FOMC 회의
데이터 출처: CME FedWatch
연준 기금 선물 시장은 다음 FOMC 회의의 금리 변동 확률을 가격에 반영합니다 — 가장 미래 지향적인 USD 통화 정책 지표입니다.
• 매파적: 예상 > 현재 + 2.5bps → USD 강세, 금 가격 하락 압력
• 비둘기파적: 예상 < 현재 - 2.5bps → USD 약세, 금 가격 상승 압력
• 중립: ±2.5bps 이내 → 명확한 방향성 편향 없음
표시: 현재 목표, 다음 회의, 예상 금리,
확률 (인하/유지/인상), 금리 분포
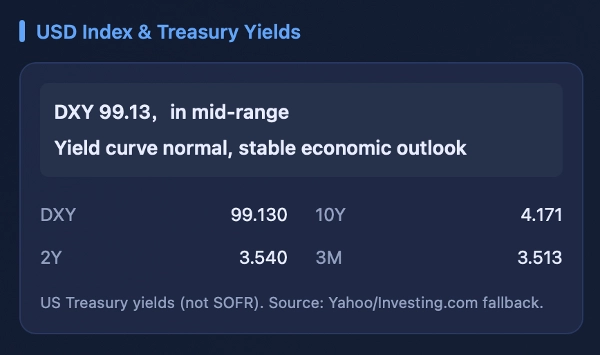
3. USD 지수 및 재무부 수익률
데이터 출처: Yahoo Finance (주요) / Investing.com (대체)
경제 전망과 USD 강세를 이해하는 주요 지표입니다.
• DXY > 105: 매우 강한 USD, 원자재에 부정적
• DXY < 95: 매우 약한 USD, 원자재에 긍정적
• 10년-2년 수익률 차 < 0 (역전): 경기 침체 신호, 위험 회피
• 10년-2년 수익률 차 > 1% (가파름): 성장 전망, 위험 선호
표시: DXY, 10년/2년/3개월 수익률, 수익률 곡선 해석
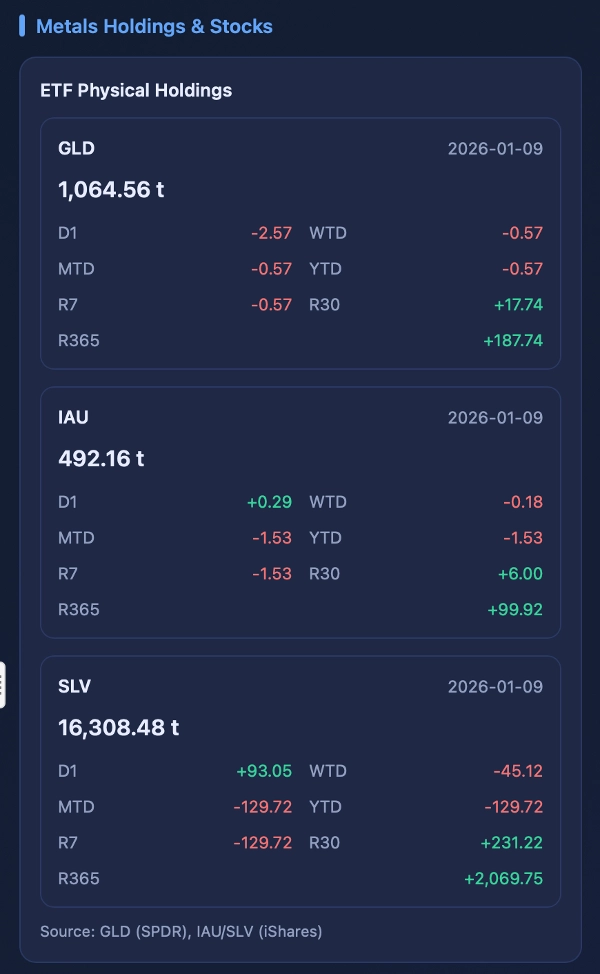
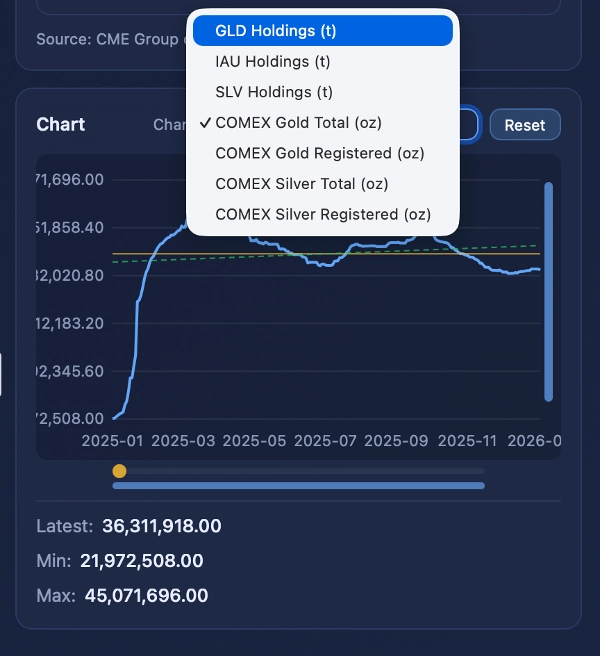
4. 금속 보유 및 재고
포괄적인 귀금속 공급 측 데이터.
데이터 출처:
• ETF 보유: GLD (SPDR), IAU/SLV (iShares)
• COMEX 재고: CME 그룹 인도 보고서
ETF 실물 보유:
실시간 톤 단위 보유량. 증가 = 축적; 감소 = 청산.
표시: GLD, IAU, SLV 보유량
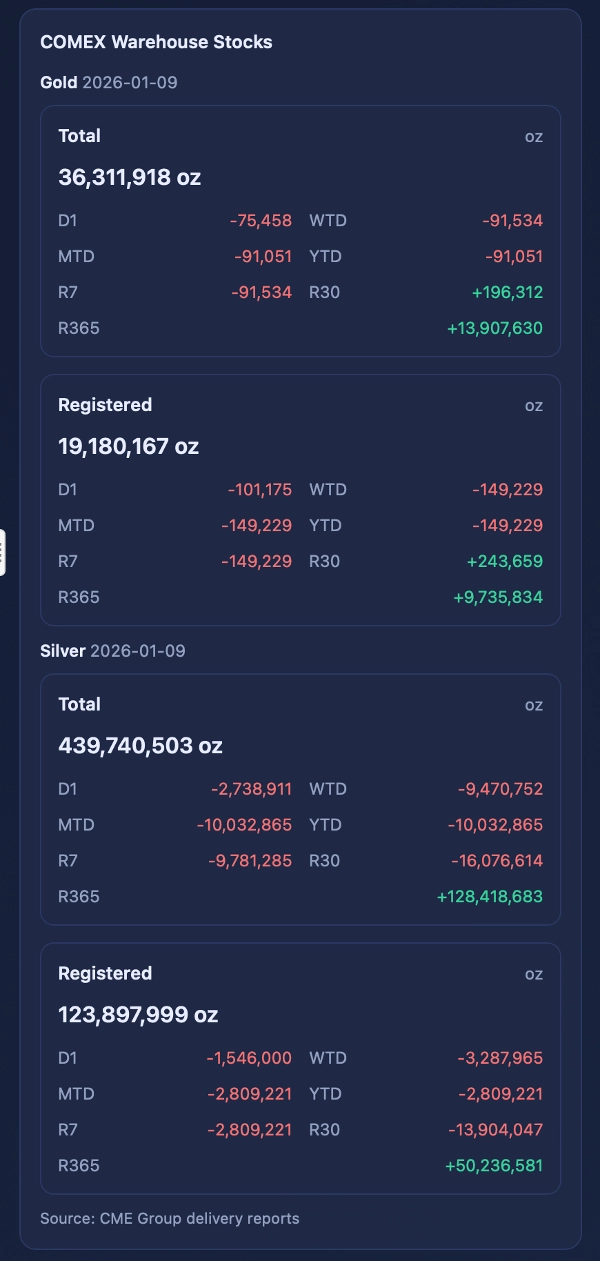
COMEX 창고 재고:
• 총계: COMEX 창고 내 모든 금속
• 등록: 선물 인도 가능 금속
표시: 금/은 총계 및 등록 (온스)
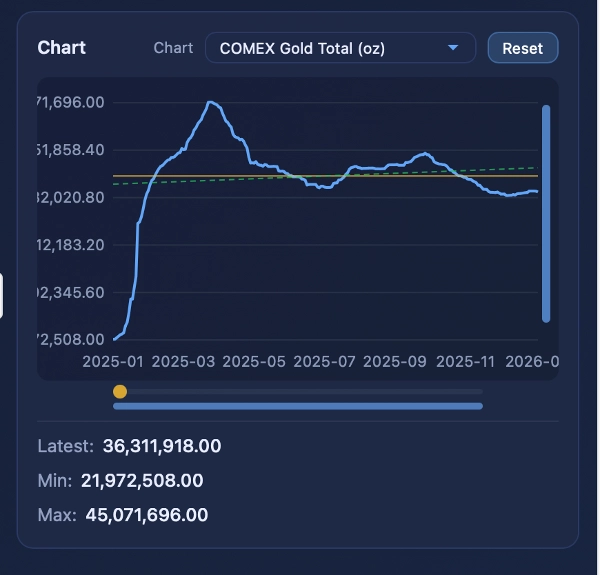
금속 차트:
7가지 모드(GLD/IAU/SLV 보유, COMEX 금/은 총계/등록)를 갖춘 인터랙티브 시계열 차트. 확대, 이동, 스크롤 및 통계 표시 기능 포함.
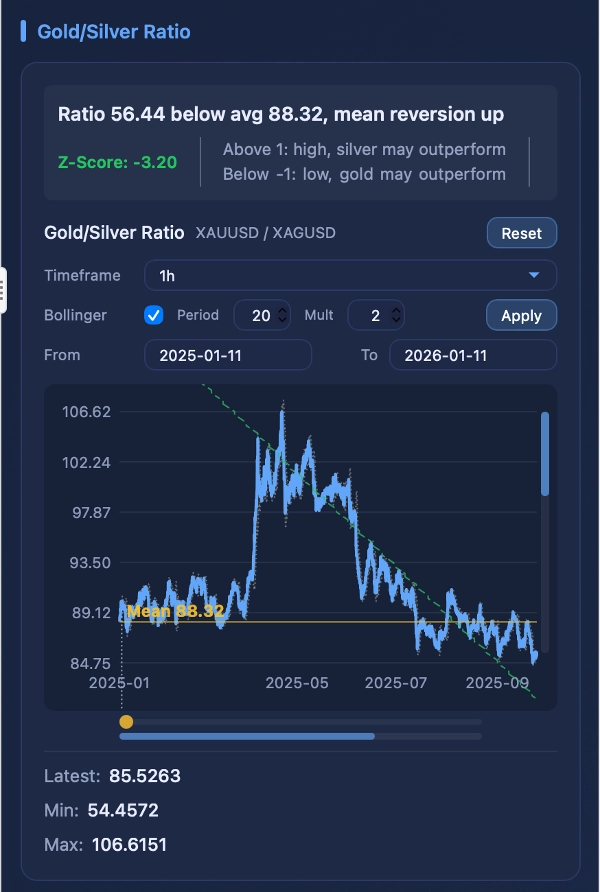
5. 금/은 비율 차트
데이터 출처: cTrader 브로커 바
비율(금/은)은 상대적 가치 평가를 보여줍니다.
역사적 범위: 40-90, 평균 약 65-70.
• Z > +1: 금이 은에 비해 고평가 → 은이 더 좋은 성과를 낼 수 있음
• Z < -1: 은이 금에 비해 고평가 → 금이 더 좋은 성과를 낼 수 있음
• Z ~ 0: 역사적 평균 근처 → 명확한 신호 없음
기능: 인터랙티브 확대/이동, 기간 선택기(1분부터 월간까지), 사용자 지정 날짜 범위, 볼린저 밴드, 후버 회귀 추세선, 색상 코딩된 Z-점수
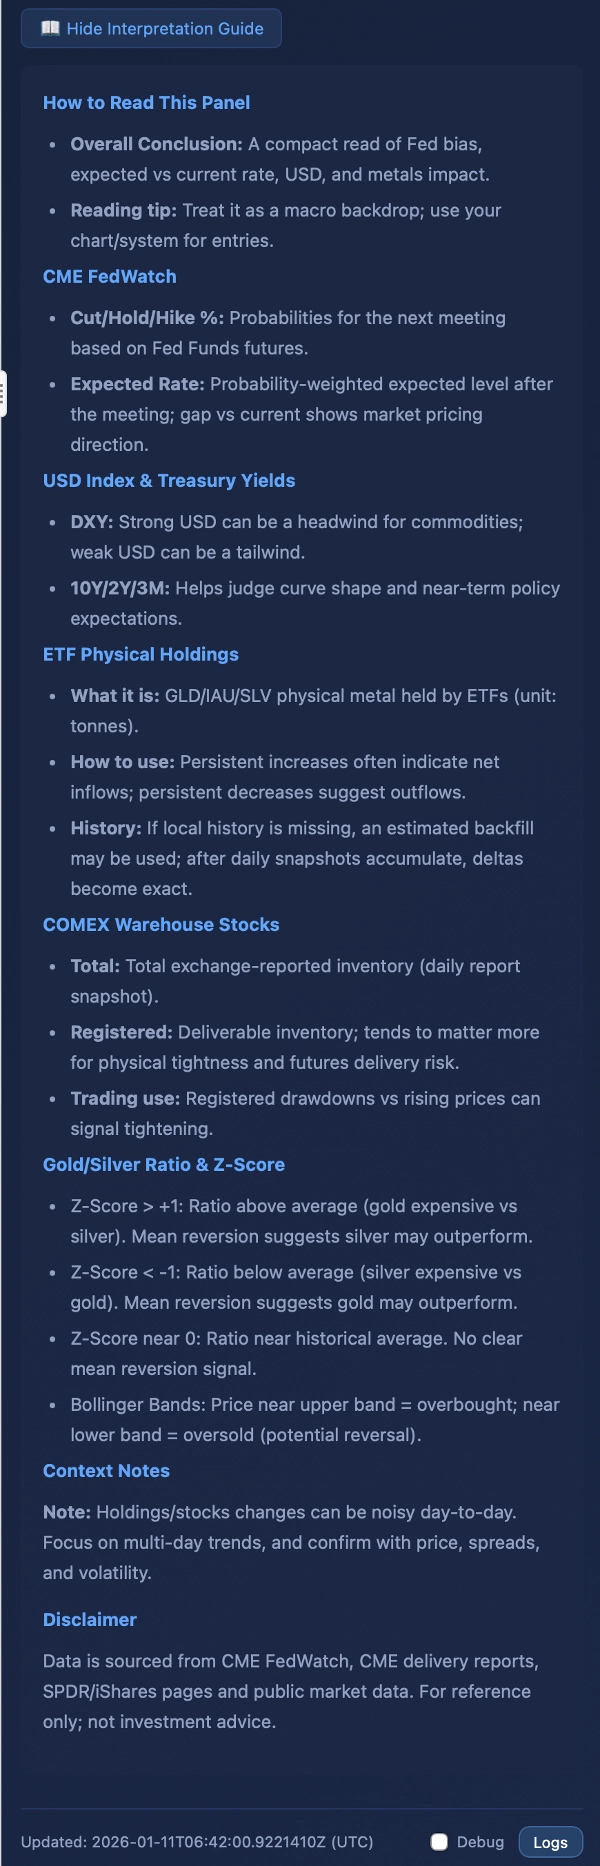
6. 해석 가이드
접을 수 있는 참조 섹션으로 연준 정책 편향, 확률 해석, Z-점수 의미 및 볼린저 밴드 사용법을 설명합니다.
매개변수
──────────
UI: 언어 (자동/영어/중국어)
시스템: 폴링 간격(기본값 120초)
금리: 일일 보정(활성화), 보정 시간(21:10 UTC)
심볼: 금/은 심볼 (자동 또는 수동)
차트: 기간(일간), 조회 바 수(300)
데이터 갱신 간격
──────────────────────
CME FedWatch: 2분
Yahoo Finance: 5분
Investing.com: 15분 (대체)
ETF 보유: 1시간
COMEX 재고: 1시간
면책 조항
──────────
FedPulse는 정보 제공용입니다. 투자 조언이 아닙니다.
거래 전에 스스로 조사하십시오.
지원
───────
질문이나 피드백이 있나요? cTrader 마켓플레이스를 통해 개발자에게 문의하세요.