
Opis
To nie jest kolejny robot RSI z losowymi ustawieniami i przetrenowanymi testami historycznymi.
Kupując tego cBota, otrzymujesz również pełen pakiet analityczny, oparty na szeroko zakrojonych testach ilościowych. Przetestowano ponad milion kombinacji parametrów na wykresach japońskich/Heiken Ashi/Renko
Jak działa strategia
Wejście Long
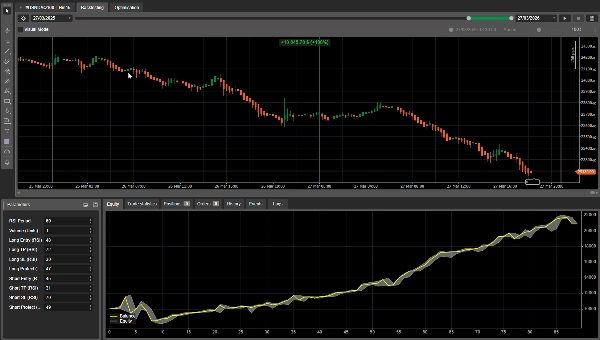
- Sygnał long jest wyzwalany, gdy RSI przebija w górę określony poziom:
(Przykład: Poziom RSI wynosił 29. Teraz jest 31. Przebija poziom 30 w górę. Tutaj cBot otwiera pozycję Long)
Wyjście Long
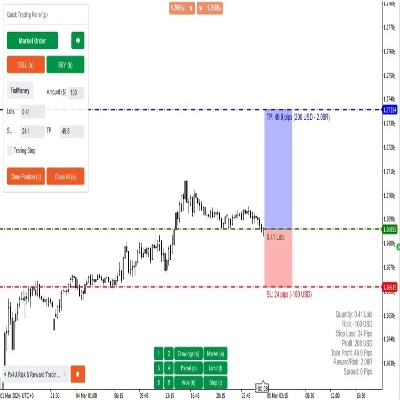
- Take Profit (TP) — wyjście po przebiciu w przeciwną stronę
Wyjście, gdy RSI przebija w dół poziom TP. Przykład: Poziom RSI wynosił 71. Teraz jest 69. Przebija poziom 70 w dół. Tutaj cBot zamyka pozycję Long.
- Wyjście ochronne — wyjście po przebiciu w przeciwną stronę (tylko jeśli transakcja jest zyskowna)
Wyjście, gdy RSI przebija w dół poziom ochrony, ale tylko jeśli pozycja jest obecnie zyskowna.
- Stop Loss (SL) — zatrzymanie na poziomie RSI (nie wymaga przebicia)
Natychmiastowe wyjście, jeśli poziom RSI dotknie SL. Przykład: Wejście w pozycję Long na poziomie RSI 30, SL wynosi 25. Gdy RSI dotknie 25, pozycja Long zostanie zamknięta.
Odwrotnie dla pozycji Short
Zarządzanie pozycją
- Robot utrzymuje tylko jedną pozycję na raz na symbol.
Czas sygnału
- Sygnały są oceniane dopiero po zamknięciu świecy.
- Jeśli pojawi się sygnał, wejście jest realizowane na OTWARCIU następnej świecy (bez zgadywania w trakcie świecy i umożliwia prawidłową ocenę strategii).
Jak weryfikuję ustawienia
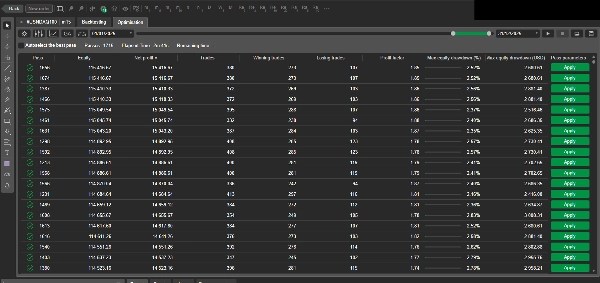
Nie „wybieram parametrów na oko” ani nie stosuję losowych wartości. Testuję szerokie przestrzenie parametrów za pomocą algorytmu genetycznego (GA):
- Automatycznie oceniane są tysiące kombinacji parametrów
- Selekcja zachowuje różnorodność, nie tylko najlepszych wykonawców (aby zmniejszyć ryzyko nadoptymalizacji)
- Testy przeprowadzane są na wielu okresach, interwałach czasowych oraz typach wykresów (japońskie / Heiken Ashi / Renko)
To generuje dużą bazę wyników i pomaga zidentyfikować stabilne obszary parametrów, a nie tylko jedną szczęśliwą konfigurację. Po pierwszym przebiegu GA wykonuję drugi etap optymalizacji skoncentrowany na najbardziej stabilnych i dochodowych obszarach parametrów.
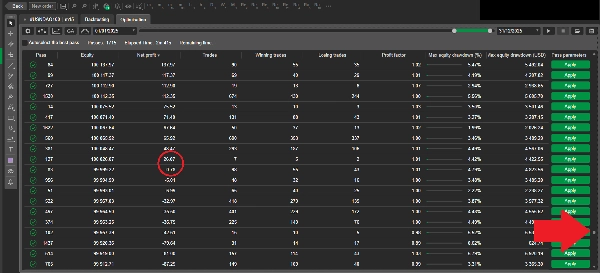
Metryki (krótka lista)
W analizach śledzę między innymi:
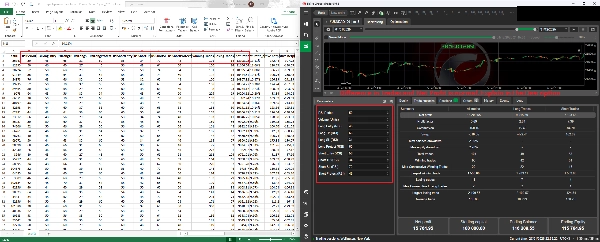
- Zysk netto, maksymalne obsunięcie kapitału
- współczynnik zysku, procent wygranych, wartość oczekiwana
- Sharpe, Sortino, Calmar
- MAE / MFE (odchylenia)
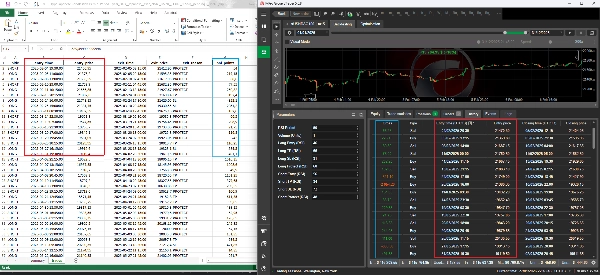
Moje wyniki GA i testy historyczne cTrader mogą się nieznacznie różnić (i jest to normalne)
Porównując moje wyniki optymalizacji genetycznej (GA) z testem historycznym cTrader, możesz zauważyć niewielkie różnice w zysku, cenie wejścia/wyjścia lub kilku pochodnych metrykach.
Te różnice są spodziewane i wynikają z dwóch kontrolowanych czynników:
1) Wymuszone zamknięcie pozycji na końcu testu (brak „otwartych transakcji”)
Mój silnik GA zawsze zamyka każdą otwartą pozycję na ostatniej świecy okna testowego. Zapobiega to „zawieszonym” lub pływającym pozycjom i sprawia, że wyniki są w pełni zrealizowane i porównywalne między przebiegami.
W cTrader, w zależności od ustawień, test historyczny może:
- pozostawić pozycję otwartą na końcu, lub
- zamknąć ją inaczej (czas/cena), lub
- obsłużyć wykonanie ostatniej świecy z nieco inną mechaniką.
To samo może spowodować niewielką różnicę w końcowym kapitale/zysku.
2) Efekty spreadu/poślizgu podczas skoków zmienności
Rzeczywiste rynki (i realistyczne symulacje) mogą wykazywać okazjonalne skoki zmienności, gdzie:
- spready się rozszerzają,
- poślizg się zwiększa,
- ceny wykonania różnią się nieznacznie.
Mój model GA uwzględnia spread + opcjonalny poślizg + prowizję, a w rzadkich segmentach o wysokiej zmienności może to przesunąć realizacje o niewielką wartość. Nawet drobna zmiana ceny może nieznacznie zmienić metryki takie jak zysk netto, obsunięcie kapitału, współczynnik zysku i inne
Pomimo tych drobnych różnic na poziomie wykonania, zachowanie strategii i wyniki są bezpośrednio porównywalne:
- wejścia/wyjścia podążają tą samą logiką,
- transakcje występują w tych samych obszarach,
- a kluczowe metryki wydajności pozostają zgodne.
Jeśli chcesz:
- pełen pakiet analityczny (T + interaktywny pulpit),
- zalecane ustawienia dla Twojego aktywa/interwału,
- lub niestandardowe badania / rozwój strategii,
Skontaktuj się ze mną poprzez link w moim profilu, aby otrzymać Analizy
Zastrzeżenie ryzyka: Ten robot służy celom edukacyjnym i badawczym. Handel wiąże się z ryzykiem, a wyniki historyczne nie gwarantują przyszłych rezultatów.
Podsumowanie
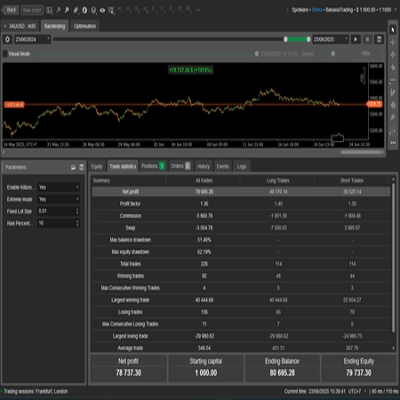
The robot manages one position per symbol at a time and evaluates signals only after bar close, executing trades at the next bar's open to avoid intrabar uncertainty. Parameter settings are optimized through extensive genetic algorithm testing, evaluating over one million parameter combinations across multiple periods, timeframes, and chart types to identify stable and profitable configurations. The package includes a full analytics suite tracking metrics such as net profit, max drawdown, profit factor, Sharpe ratio, and more.
Backtests use 100:1 leverage and market orders, with risk management via fixed lot sizing, take profit, and stop loss tools. Recommended minimum balance is $10,000 with 1% risk per trade and a maximum drawdown of 26.5%. The strategy targets low-frequency trades on instruments including BTCUSD, XAUUSD, NAS100, and indices.
Opinie klientów
5 | 0 % | |
4 | 100 % | |
3 | 0 % | |
2 | 0 % | |
1 | 0 % |