Penerangan
Gambaran Keseluruhan
Strategi ini menggabungkan dua penunjuk teknikal popular untuk mengenal pasti peluang perdagangan berkemungkinan tinggi:
- Bollinger Bands digunakan untuk mengesan harga yang melampau dan zon pembalikan yang berpotensi. Perdagangan dibuka apabila harga menyentuh jalur atas atau bawah.
- Relative Strength Index (RSI) menapis isyarat ini dengan mengukur momentum pasaran. Perdagangan panjang hanya diambil apabila RSI berada dalam zon terlebih jual, dan perdagangan pendek diambil apabila RSI terlebih beli.
Dengan menggabungkan analisis trend dan momentum, robot ini bertujuan untuk memperbaiki masa kemasukan dan mengurangkan isyarat palsu.
Tetapan Utama
Semua parameter boleh disesuaikan sepenuhnya dalam panel konfigurasi cBot:
- Isipadu (lot) – saiz posisi. Lalai: 0.01 lot.
- Stop Loss / Take Profit (pips) – tahap risiko dan ganjaran awal. Lalai: 15 pips SL dan 30 pips TP.
- Tempoh RSI – tempoh pengiraan untuk RSI (lalai: 14).
- Tahap RSI Terlebih Beli / Terlebih Jual – ambang yang mencetuskan setup pendek/panjang (lalai: 70 dan 30).
- Tempoh Bollinger – bilangan bar yang digunakan untuk mengira jalur (lalai: 20).
- Sisihan Piawai Bollinger – lebar jalur (lalai: 2.0).
Anda boleh melaraskan input ini untuk menyesuaikan dengan simbol dan jangka masa yang berbeza.
Nota Penting
Ini adalah strategi mudah dan eksperimental yang direka untuk menunjukkan bagaimana pelbagai penunjuk boleh digabungkan dalam cBot. Ia tidak bertujuan sebagai nasihat kewangan dan tidak menjamin keuntungan; gunakan atas risiko anda sendiri dan sentiasa uji pada akaun demo sebelum beroperasi secara langsung.
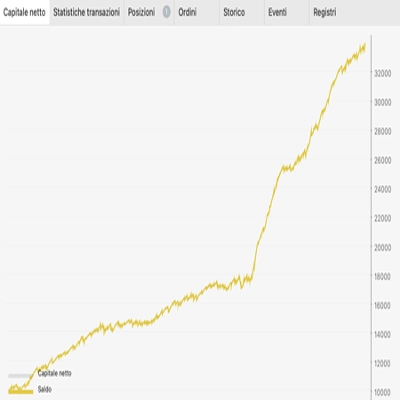
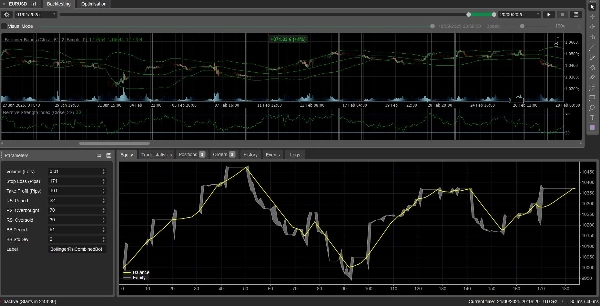
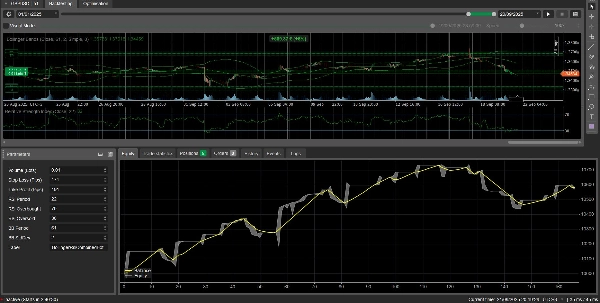
Sorotan Ujian Semula
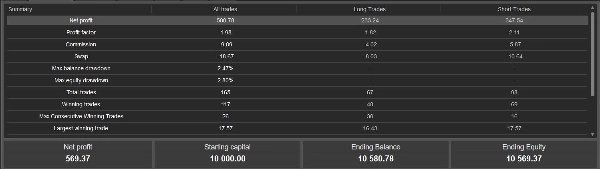
Semasa ujian baru-baru ini pada data sejarah EURUSD (jangka masa H1) dengan tetapan lalai, bot menghasilkan keputusan berikut (lihat tangkapan skrin yang dilampirkan):
- Keuntungan bersih: $580.78 (baki permulaan $10,000)
- Faktor keuntungan: 1.98
- Jumlah perdagangan: 165, di mana 117 adalah pemenang
- Penurunan baki maksimum: 2.47 %
- Perdagangan menang terbesar: $17.57
- Ekuiti akhir: $10,569.37
Angka-angka ini adalah untuk tujuan ilustrasi sahaja; prestasi lalu tidak menjamin keputusan masa depan.