
Penerangan
Ultimate RSI (Indeks Kekuatan Relatif)
The Ultimate RSI adalah osilator maju dan tersuai yang direka untuk memberikan bacaan momentum pasaran dan kekuatan tren yang lebih lancar, lebih bersih, dan lebih responsif. Ia mewakili peningkatan ketara berbanding Indeks Kekuatan Relatif (RSI) tradisional, dengan fokus menapis bunyi pasaran dan meminimumkan isyarat palsu (whipsaws). Ini menjadikannya alat yang sangat berharga untuk mengesahkan tren dan mengenal pasti titik perubahan yang boleh dipercayai.
Ciri-ciri Utama dan Penambahbaikan:
- Pengiraan Momentum Dipertingkatkan: Penunjuk menggunakan kaedah canggih untuk mengira perubahan harga. Daripada hanya bergantung pada pergerakan harga harian, isyarat momentum diperkuat dengan ketara apabila harga mencatatkan paras tertinggi atau terendah baru dalam tempoh tinjauan. Proses ini memastikan penunjuk bertindak balas dengan kuat terhadap penembusan sebenar sambil mengabaikan pergerakan kecil yang tidak menentu.
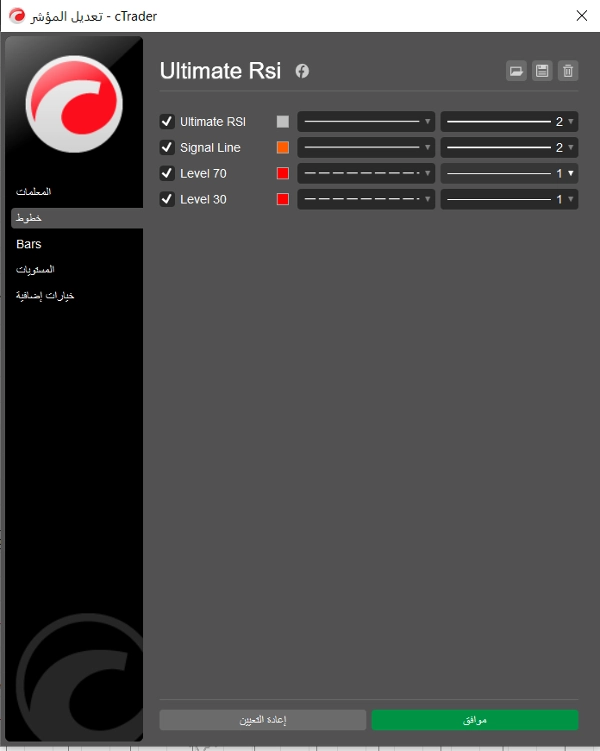
- Garis Isyarat Khusus: Ia termasuk Garis Isyarat yang berbeza (purata bergerak RSI itu sendiri) yang boleh dikonfigurasikan secara bebas. Persilangan antara garis Ultimate RSI dan Garis Isyaratnya sering digunakan sebagai pencetus yang lebih jelas dan lebih yakin untuk kemasukan atau keluar, terutamanya berhampiran paras terlebih beli/terlebih jual.
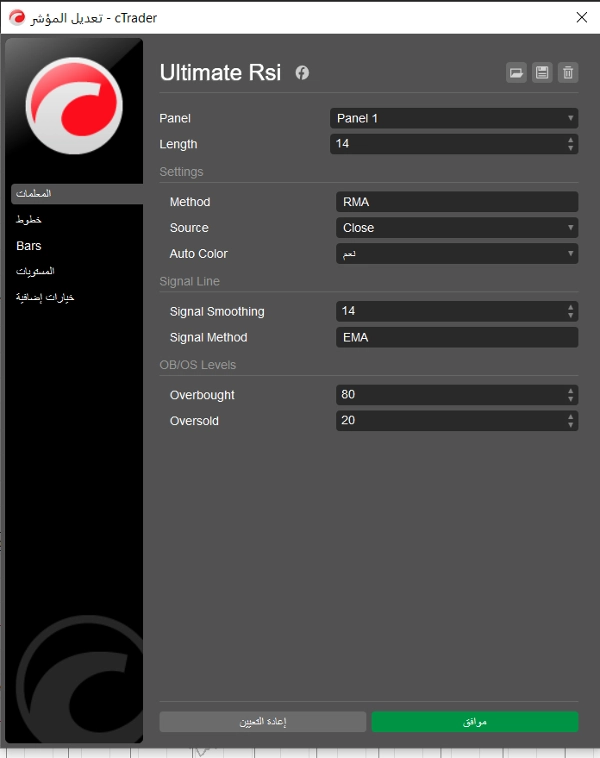
- Kaedah Pelicinan Fleksibel: Pengguna mempunyai fleksibiliti untuk memilih jenis pelicinan bagi pengiraan RSI dan Garis Isyarat daripada pilihan biasa: EMA (Purata Bergerak Eksponen), SMA (Purata Bergerak Mudah), RMA (Purata Bergerak Wilder), dan TMA (Purata Bergerak Segitiga). Ini membolehkan penyesuaian tepat kepekaan penunjuk.
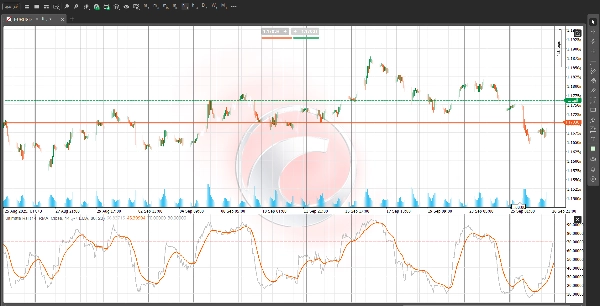
- Zon OB/OS Visual: Paras terlebih beli (OB) lalai pada 80 dan paras terlebih jual (OS) pada 20 ditandakan dengan jelas menggunakan latar belakang berbayang. Dalam pasaran yang tren kuat, bacaan berterusan dalam zon ini sering menunjukkan kekuatan tren yang luar biasa dan bukannya pembalikan segera, menawarkan alat pengesahan yang kuat untuk strategi mengikuti tren.
Cara Berdagang dengan Ultimate RSI:
- Pengesahan Tren: Gunakan paras 50 sebagai pusat momentum. Bacaan yang konsisten di atas 50 mengesahkan bias menaik, manakala bacaan di bawah 50 mengesahkan bias menurun.
- Isyarat Kemasukan: Cari garis Ultimate RSI melintasi di atas Garis Isyarat untuk kemasukan panjang yang berpotensi, dan melintasi di bawah Garis Isyarat untuk kemasukan pendek yang berpotensi, dengan memberi perhatian khusus kepada lokasi persilangan ini berbanding paras 50.
- Pengurangan Bunyi: Dengan menekankan pengembangan julat sebenar dan menggunakan pelicinan maju, Ultimate RSI membantu pedagang mengekalkan fokus semasa tempoh pengukuhan, mengelakkan kemasukan atau keluar yang terlalu awal.
Penafian: Penerangan ini adalah untuk tujuan maklumat dan pendidikan sahaja. Perdagangan melibatkan risiko, dan semua bacaan penunjuk harus digabungkan dengan analisis tindakan harga yang menyeluruh untuk sebarang keputusan perdagangan.


