Descrição
FedPulse - Plugin de Análise da Política do Fed para cTrader
═══════════════════════════════════════════════════
Tipo: Plugin para Desktop | Plataforma: cTrader | Direitos de Acesso: Nenhum
O QUE É O FEDPULSE?
─────────────────
Pare de alternar entre CME FedWatch, sites do Tesouro e páginas de ETF.
O FedPulse reúne tudo o que você precisa para análise da política do Fed e metais preciosos
em um único painel unificado do cTrader.
✓ Expectativas de taxa CME FedWatch em tempo real
✓ Monitoramento do DXY e da curva de rendimento do Tesouro
✓ Rastreamento de participações em ETFs (GLD, IAU, SLV)
✓ Dados de inventário dos depósitos da COMEX
✓ Relação Ouro/Prata com análise estatística
Desenvolvido para traders de metais e FX que desejam se antecipar às mudanças
na política do Fed sem sair da sua plataforma de negociação.
→ Experimente o teste gratuito de 7 dias para explorar todos os recursos.
QUEM DEVE USAR O FEDPULSE?
────────────────────────
• Traders de Ouro/Prata que monitoram fundamentos macroeconômicos
• Traders de FX que acompanham a direção da política do USD
• Traders swing que sincronizam entradas em torno de eventos do FOMC
• Traders de posição que analisam dados do lado da oferta
• Qualquer pessoa que verifica o CME FedWatch regularmente
MÓDULOS DO PAINEL
─────────────
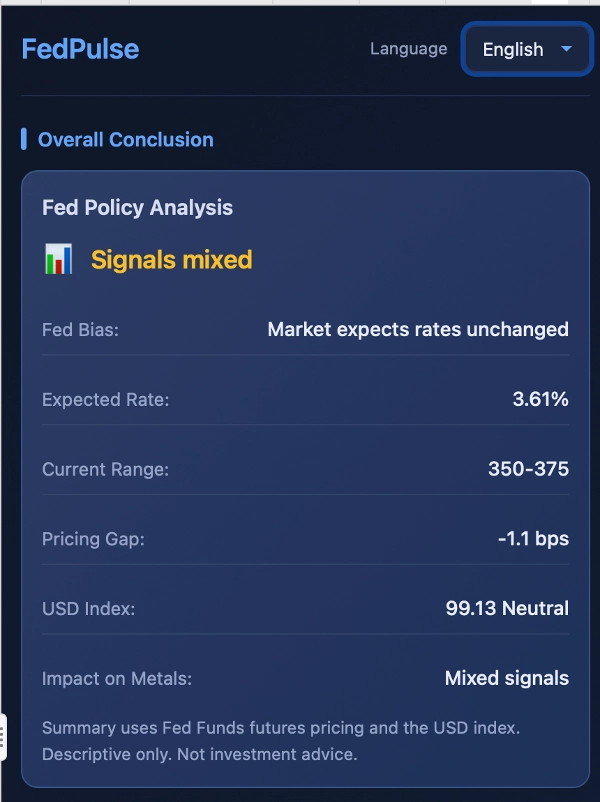
1. Conclusão Geral
Um painel resumido rápido mostrando a posição chave da política do Fed de relance.
Exibe: Tendência do Fed, Taxa Esperada, Faixa Atual, Diferença de Precificação, DXY,
Impacto nos Metais
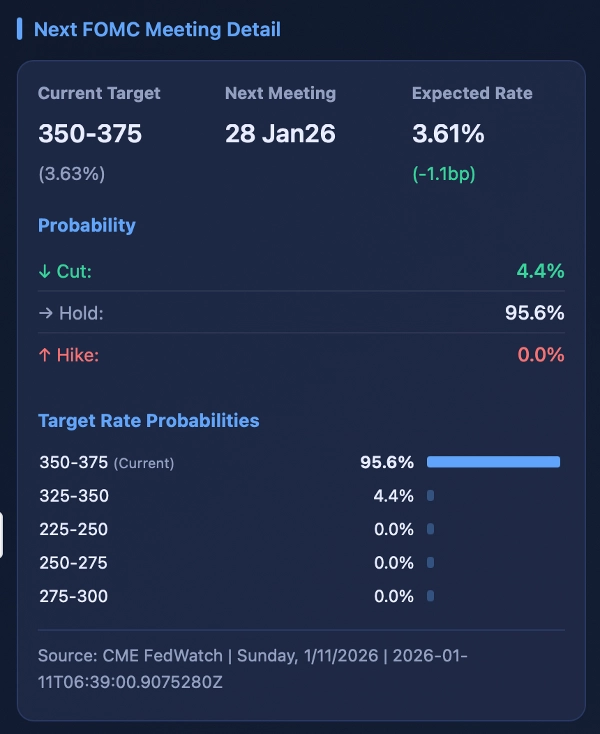
2. CME FedWatch - Próxima Reunião do FOMC
Fonte dos Dados: CME FedWatch
O mercado de futuros dos Fed Funds precifica as probabilidades de mudança de taxa para a
próxima reunião do FOMC — o indicador de política monetária do USD mais prospectivo.
• Hawkish: Esperado > Atual + 2.5bps → Força do USD, vento contrário para Au
• Dovish: Esperado < Atual - 2.5bps → Fraqueza do USD, vento favorável para Au
• Neutro: Dentro de ±2.5 bps → Sem viés direcional claro
Exibe: Alvo Atual, Próxima Reunião, Taxa Esperada,
Probabilidade (Corte/Manutenção/Aumento), Distribuição da Taxa
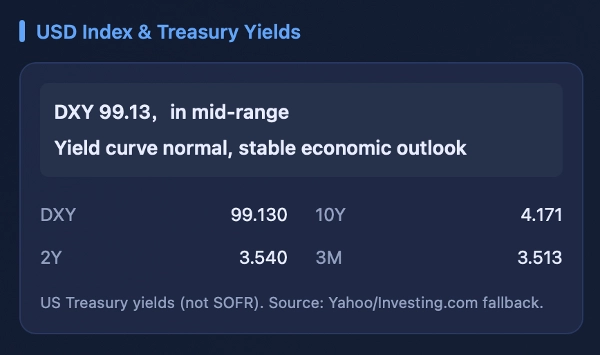
3. Índice USD & Rendimentos do Tesouro
Fonte dos Dados: Yahoo Finance (primário) / Investing.com (alternativo)
Indicadores chave para entender a perspectiva econômica e a força do USD.
• DXY > 105: USD muito forte, vento contrário para commodities
• DXY < 95: USD muito fraco, vento favorável para commodities
• 10Y-2Y < 0 (Invertido): Sinal de recessão, risco de aversão
• 10Y-2Y > 1% (Íngreme): Perspectiva de crescimento, risco de busca
Exibe: DXY, Rendimentos 10Y/2Y/3M, Interpretação da Curva de Rendimentos
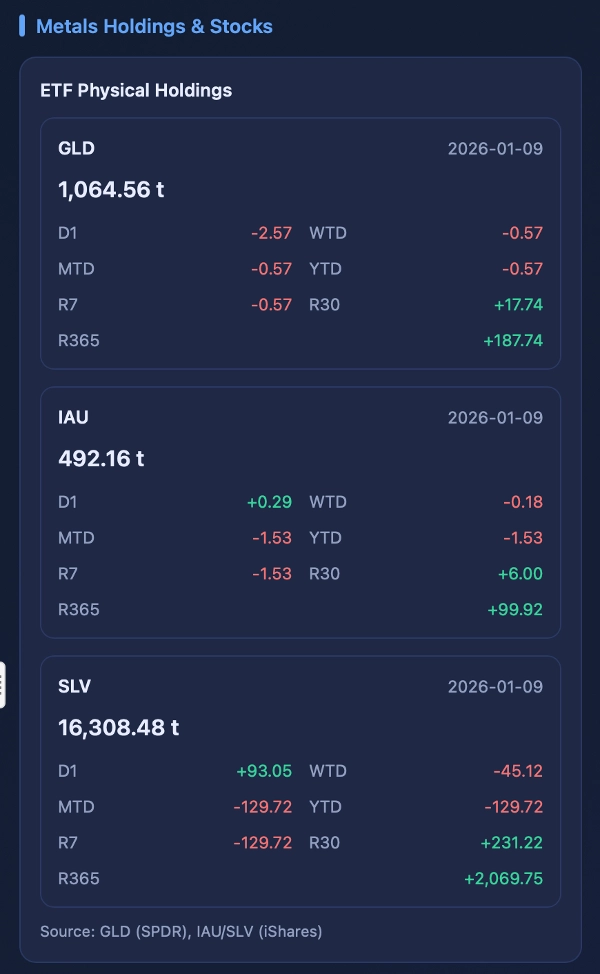
4. Participações & Estoques de Metais
Dados abrangentes do lado da oferta de metais preciosos.
Fontes dos Dados:
• Participações em ETF: GLD (SPDR), IAU/SLV (iShares)
• Estoques COMEX: relatórios de entrega do CME Group
Participações Físicas em ETF:
Participações em tempo real em toneladas. Crescente = acumulação; Decrescente = liquidação.
Exibe: participações GLD, IAU, SLV
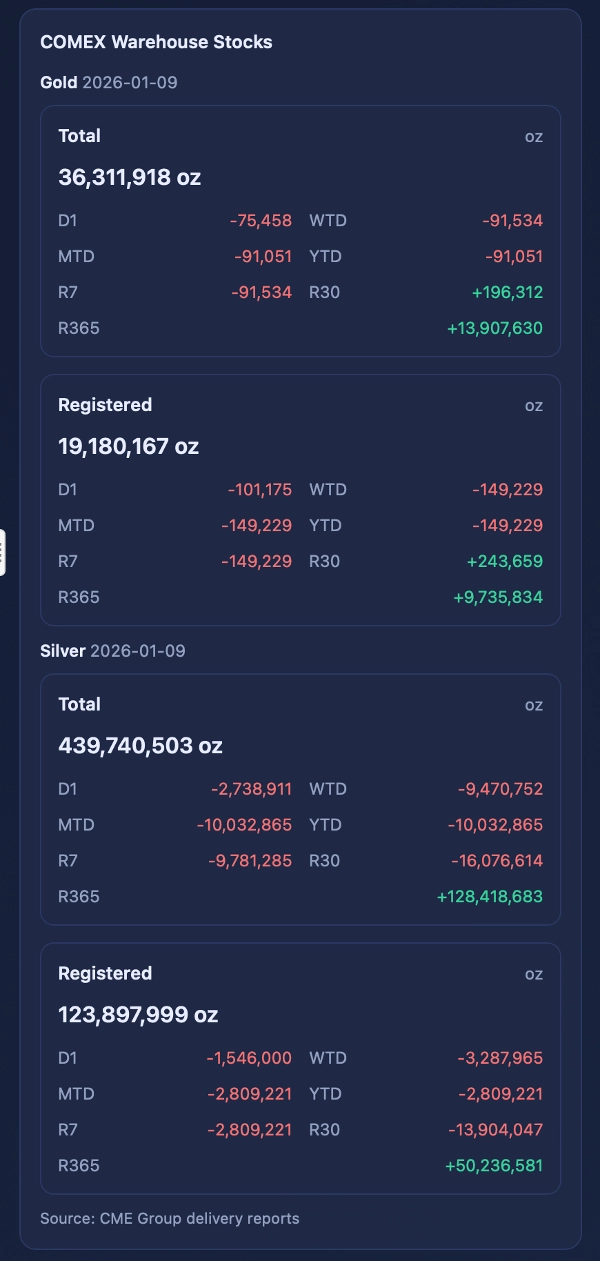
Estoques em Depósitos COMEX:
• Total: Todo o metal nos depósitos COMEX
• Registrado: Metal disponível para entrega em futuros
Exibe: Total e Registrado de Ouro/Prata (oz)
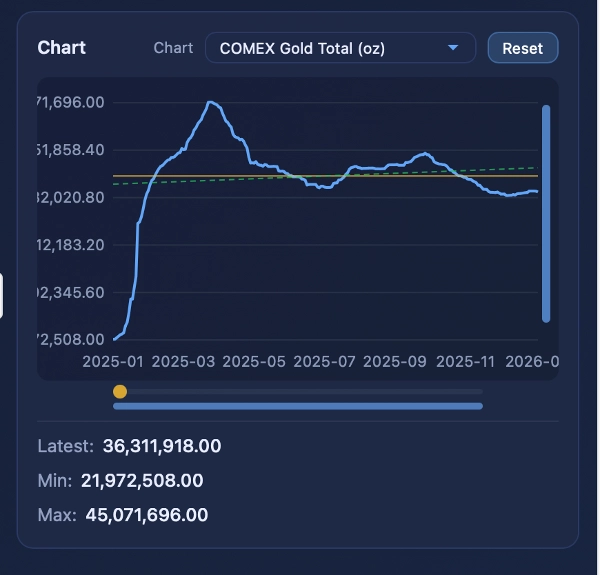
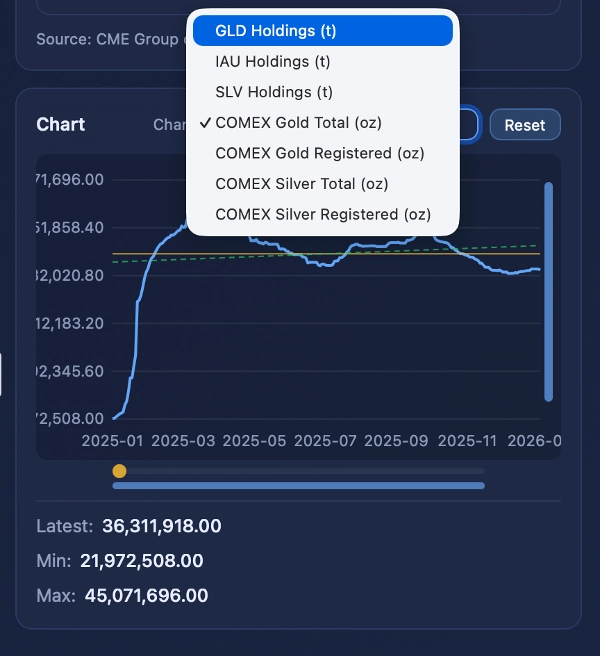
Gráfico de Metais:
Gráfico interativo de séries temporais com 7 modos (participações GLD/IAU/SLV,
Total/Registrado de Ouro/Prata COMEX). Recursos de zoom, panorâmica, rolagem,
e exibição de estatísticas.
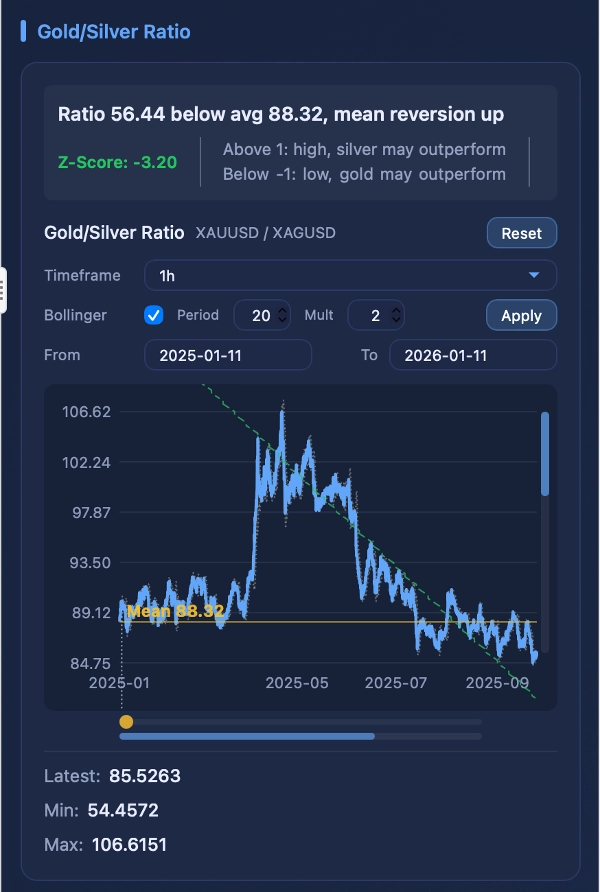
5. Gráfico da Relação Ouro/Prata
Fonte dos Dados: barras do corretor cTrader
A relação (Ouro/Prata) mostra a avaliação relativa.
Faixa histórica: 40-90, média ~65-70.
• Z > +1: Ouro caro em relação à prata → Prata pode superar
• Z < -1: Prata cara em relação ao ouro → Ouro pode superar
• Z ~ 0: Próximo da média histórica → Sem sinal claro
Recursos: zoom/pan interativo, seletor de período (1m a Mensal),
intervalo de datas personalizado, Bandas de Bollinger, linha de tendência de regressão de Huber,
Z-Score com codificação de cores
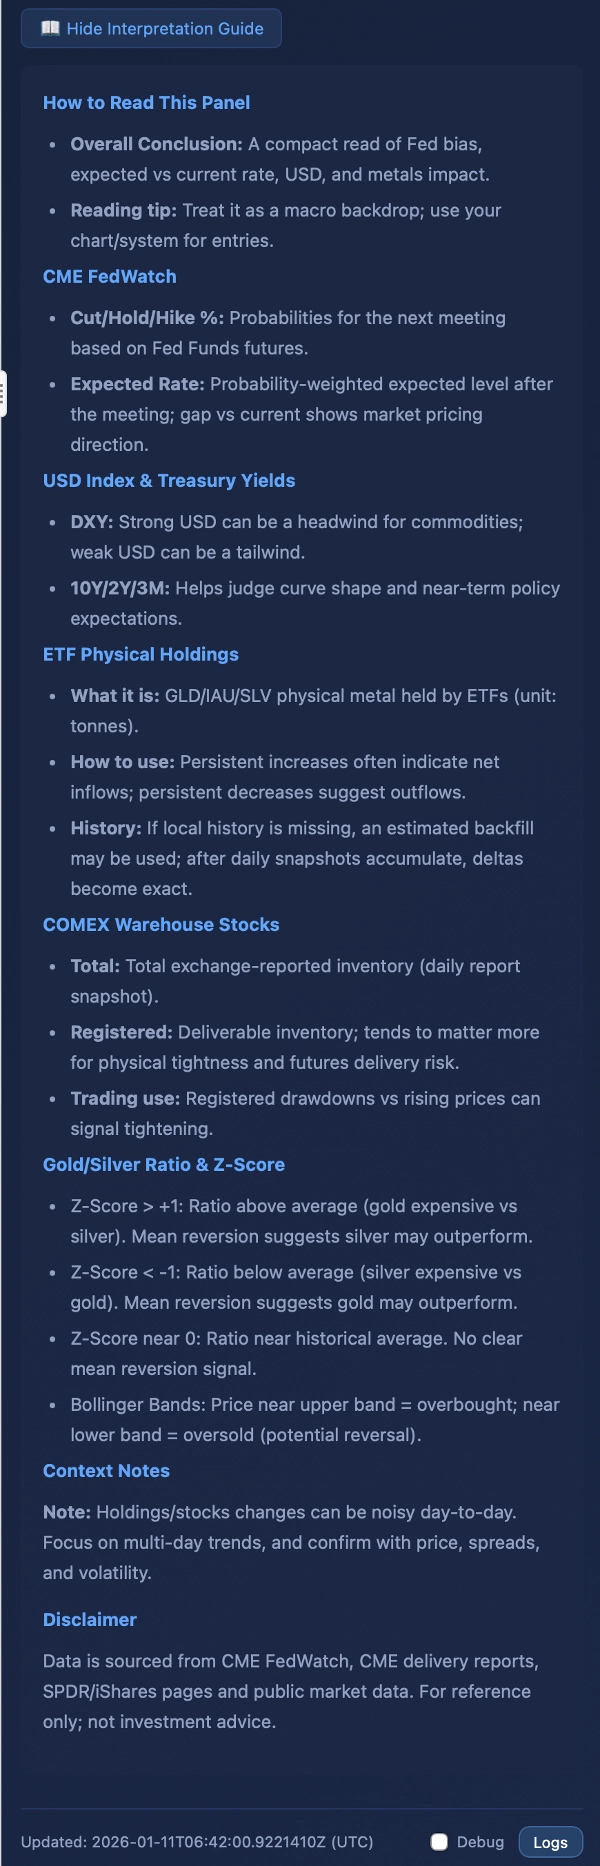
6. Guia de Interpretação
Seção de referência recolhível explicando o viés da política do Fed,
interpretação de probabilidades, significado do Z-score e uso das Bandas de Bollinger.
PARÂMETROS
──────────
UI: Idioma (Auto/Inglês/Chinês)
Sistema: Segundos de Polling (padrão 120)
Taxas: Calibração Diária (ativada), Hora da Calibração (21:10 UTC)
Símbolos: Símbolo Ouro/Prata (AUTO ou manual)
Gráfico: Período (Diário), Barras de Retrospectiva (300)
INTERVALOS DE ATUALIZAÇÃO DE DADOS
──────────────────────
CME FedWatch: 2 min
Yahoo Finance: 5 min
Investing.com: 15 min (alternativo)
Participações em ETF: 1 hora
Estoques COMEX: 1 hora
ISENÇÃO DE RESPONSABILIDADE
──────────
FedPulse é apenas informativo. Não é aconselhamento de investimento.
Realize sua própria pesquisa antes de negociar.
SUPORTE
───────
Dúvidas ou feedback? Contate o desenvolvedor através do marketplace do cTrader.