
Penerangan
Meravith Auto adalah versi automatik sistem perdagangan manual Meravith.
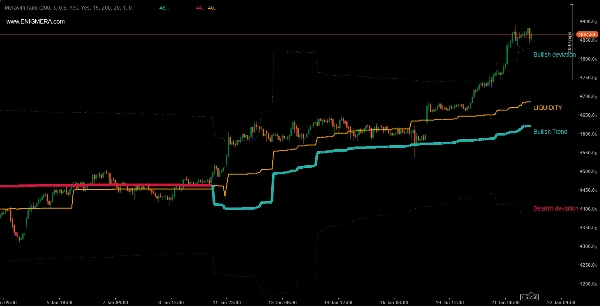
Penunjuk ini terdiri daripada:
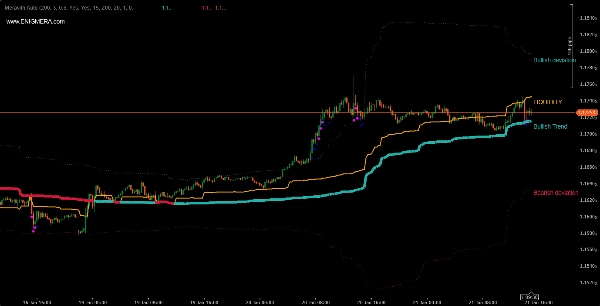
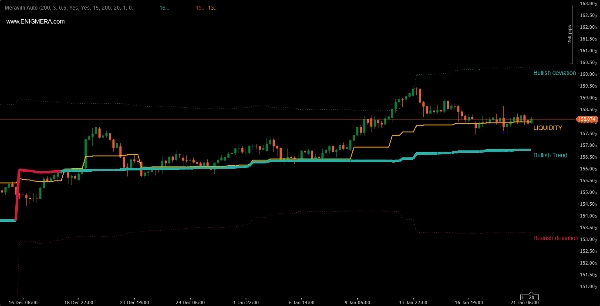
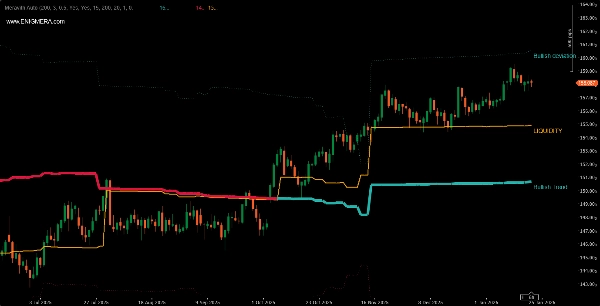
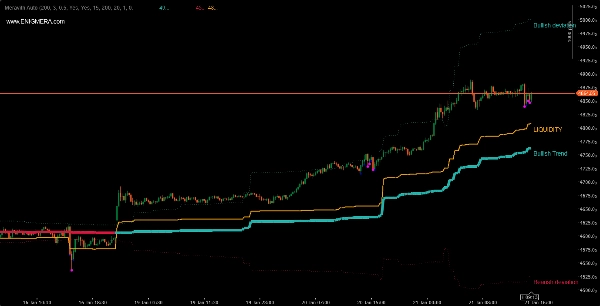
- Garis tren yang menukar warnanya. Apabila bullish ia berwarna hijau, dan apabila bearish ia berwarna merah. Ini adalah garis sokongan tren.
- Garis kecairan, di mana volum bullish sama dengan volum bearish.
- Garis penyimpangan bullish tiga kali ganda.
- Garis penyimpangan bearish tiga kali ganda.
- Titik ungu dan biru yang menunjukkan volum tinggi. Titik ungu menunjukkan volum lebih besar sebanyak dua penyimpangan dari volum purata, dan titik biru dua penyimpangan.
Bagaimana menggunakannya?
- Garis tren bullish ditambah kecairan di atas garis tren sama dengan tren bullish. Kami menjangkakan pasaran akan bergerak ke atas. Kami membuka posisi panjang.
- Garis tren bearish ditambah kecairan di bawah garis tren sama dengan tren bearish. Kami menjangkakan pasaran akan bergerak ke bawah. Kami membuka posisi pendek.
Gabungkan mengikut budi bicara anda dengan penunjuk lain.
Ia boleh digunakan pada mana-mana pasangan dan mana-mana jangka masa.
Anda mungkin melihat keputusan yang berbeza dengan broker yang berbeza disebabkan oleh volum yang mereka sebutkan.
Broker yang lebih besar adalah lebih disukai kerana volum yang lebih tinggi.
Apakah perbezaan antara versi automatik dan manual?
- Dalam versi manual, kami mempunyai penilaian tren berdasarkan paras tinggi dan rendah. Oleh itu, ia juga menyediakan tahap keletihan volum dalam pasaran.
- Dalam versi automatik, kami mempunyai tempoh yang berubah mengikut fasa pasaran yang berbeza. Ia boleh berubah, menjadi pendek semasa volatiliti tinggi dan panjang semasa volatiliti rendah. Di sini tiada tahap keletihan, kerana tren tidak dianalisis, tetapi tempoh. Ini adalah sebab kami mempunyai penyimpangan. Secara lalai, penyimpangan tiga kali ganda dipaparkan.
Ringkasan
Profil indikator
Ulasan pelanggan
0.0
Ulasan: 0
Ulasan pelanggan
Belum ada ulasan untuk produk ini. Anda sudah mencuba produk tersebut? Jadilah yang pertama untuk berkongsi pendapat anda!
Perbincangan
Soalan Lazim
BTCUSD
Forex
Signal
Breakout
Indices
EURUSD
Commodities
GBPUSD
NZDUSD
Prop
Scalping
Crypto
Stocks
XAUUSD
NAS100
USDJPY
VWAP
Produk yang tersedia melalui cTrader Store, termasuk bot dagangan, indikator dan plugin, disediakan oleh pembangun pihak ketiga dan diberikan akses untuk tujuan maklumat dan teknikal sahaja. cTrader Store bukan broker dan tidak memberikan nasihat pelaburan, syor peribadi atau sebarang jaminan prestasi masa hadapan.


Harga
Sejak 24/10/2025