Penerangan
Masalah: Beban Maklumat
Kebanyakan pedagang gagal kerana carta mereka dipenuhi dengan penunjuk yang tertinggal dan terlalu banyak garis. Mereka kehilangan fokus pada perkara yang paling penting: Struktur Pasaran.
Penyelesaian: Struktur Bias Trend
Penunjuk ini adalah kuasa "Dua-dalam-Satu" untuk platform cTrader. Ia menggabungkan Pengesanan Ayunan tahap profesional dengan Enjin Skor objektif yang memberitahu anda dengan tepat siapa yang mengawal pasaran.
Ciri-ciri Utama:
- Pemetaan Struktur Pintar: Secara automatik mengenal pasti tahap Sokongan dan Rintangan yang signifikan menggunakan volatiliti yang ditapis ATR.
- Enjin Skor SGE: Sistem penggredan unik (-2, 0, +2) yang mengira kekuatan trend berdasarkan berapa banyak tahap struktur yang telah dilanggar.
- Teknologi Anti-Kekacauan: Hanya memaparkan 3 tahap terdekat yang relevan dengan harga semasa. Carta anda kekal bersih, profesional, dan boleh diambil tindakan.
- Pengesanan Momentum: Menggunakan logik "Lilin Besar" untuk memastikan anda hanya berdagang pergerakan dengan sokongan institusi sebenar.
- Sepenuhnya Boleh Disesuaikan: Sesuaikan kepekaan mengikut aset khusus anda (XAUUSD, Forex, atau Indeks).
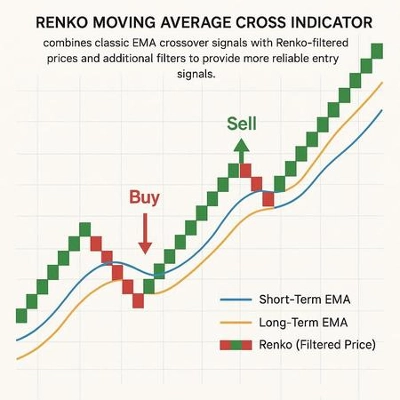
Cara Berdagang dengan ia:
- Periksa Skor: Cari +2 (Bullish) atau -2 (Bearish).
- Tunggu Tarikan Balik: Biarkan harga kembali ke salah satu Garis Struktur yang dilukis.
- Laksanakan: Berdagang dengan bias, menggunakan tahap sebagai sauh masuk/keluar anda.
Spesifikasi Teknikal
- Platform: cTrader
- Bahasa: C# (.NET)
- Jangka Masa: Berfungsi pada semua jangka masa (M1 hingga Bulanan).
- Aset: Dioptimumkan untuk pasangan berliquidity tinggi (XAUUSD, EURUSD, GBPUSD).
Nota: Tetapan Awal: Untuk kebanyakan pasangan utama, tetapan lalai dioptimumkan. Jika anda berdagang indeks yang tidak stabil, anda mungkin ingin meningkatkan Range Global ATR Mult kepada 2.0
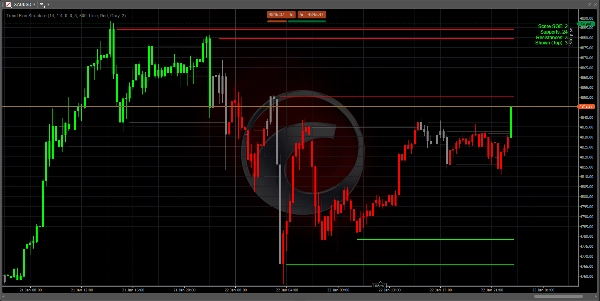
Penting: Membaca Papan Pemuka
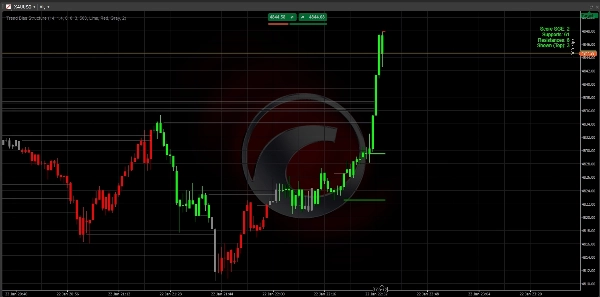
Papan pemuka di sudut kanan atas adalah pusat kawalan anda:
- Skor +2 (Hijau): Bullish Kuat. Hanya cari setup Beli.
- Skor -2 (Merah): Bearish Kuat. Hanya cari setup Jual.
- Skor 0 (Kelabu): Neutral. Pasaran sedang dalam julat atau peralihan. Bersabarlah.
- Sokongan/Rintangan: Menunjukkan berapa banyak "lantai" dan "siling" sejarah yang wujud dalam trend semasa.
Strategi Masuk 3 Langkah
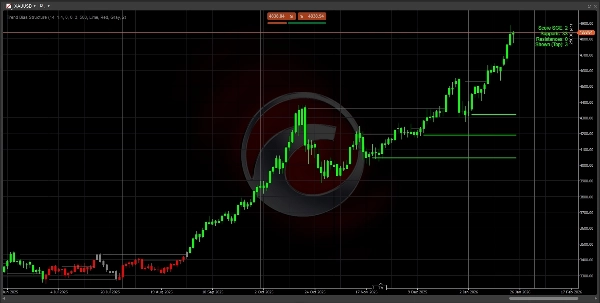
Langkah 1: Kenal Pasti Bias Tunggu warna lilin dan skor Papan Pemuka mencapai +2 atau -2. Ini mengesahkan bahawa pasaran telah memecahkan struktur dan trend sedang bermula.
Langkah 2: Kawasan Nilai Jangan kejar harga. Tunggu harga untuk menarik balik (retracement) ke salah satu 3 garis terdekat yang dilukis pada carta anda.
- Dalam trend menurun (Skor -2), tunggu harga menyentuh Garis Merah.
- Dalam trend menaik (Skor +2), tunggu harga menyentuh Garis Hijau.
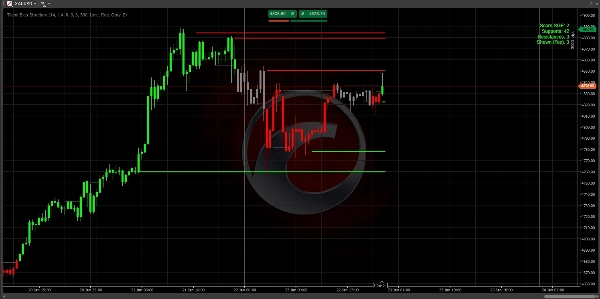
Langkah 3: Pelaksanaan Masuk perdagangan anda apabila harga menyentuh garis dan menunjukkan penolakan (sebatang sumbu terbentuk).
- Henti Rugi: Letakkan SL anda tepat di belakang garis struktur.
- Ambil Untung: Sasarkan garis struktur seterusnya mengikut arah trend.
Petua Profesional untuk Kejayaan
- Peraturan Jangka Masa Lebih Tinggi: Skor +2 pada carta H4 atau D1 jauh lebih kuat daripada skor pada carta M5. Gunakan jangka masa lebih tinggi untuk mencari bias, dan jangka masa lebih rendah untuk mencari kemasukan anda.
- Carta Bersih: Jika skrin terasa sibuk, pergi ke tetapan dan ubah
Max Levels to Showkepada 2. Ini akan menunjukkan hanya "Lantai" dan "Siling" yang paling kritikal. - Zon "Nol": Apabila skor adalah 0, pasaran sedang "mengira semula." Ini adalah masa terbaik untuk mengambil keuntungan dari perdagangan sebelumnya dan menunggu pecahan baru.
Penyelesaian Masalah
- Tiada Garis Nampak? Periksa sama ada anda mempunyai sejarah yang cukup dimuatkan pada carta anda. Penunjuk memerlukan sekurang-kurangnya 100-200 bar untuk mengira ATR dan tahap Ayunan.
- Penangguhan Penunjuk? Jika PC anda perlahan, kurangkan tetapan
Max Historical Lineskepada 200 untuk membersihkan memori dengan lebih cepat.
Soalan Lazim (FAQ)
S: Adakah penunjuk ini mengecat semula?
J: Tidak. Tahap dan skor dikira berdasarkan penutupan lilin yang disahkan. Setelah tahap dilanggar atau skor berubah pada penutupan lilin, ia dikunci dalam sejarah.
S: Jangka masa mana yang terbaik?
J: Logiknya adalah universal. Walau bagaimanapun, kebanyakan pedagang profesional menggunakannya pada carta H1, H4, atau Harian untuk mengenal pasti "Struktur Institusi." Jika anda scalping pada M1 atau M5, jangka perubahan skor lebih kerap.
S: Bolehkah saya menggunakan ini dengan penunjuk lain?
J: Ya! Ia berfungsi dengan sempurna sebagai "Penapis Arah." Contohnya, hanya ambil isyarat RSI terlebih jual jika Skor Bias Trend adalah +2.
Selamat Berdagang!
Tiada Nasihat Kewangan. Penunjuk Struktur Bias Trend adalah alat analisis teknikal yang direka untuk membantu pedagang mengenal pasti struktur pasaran dan bias trend.
Ringkasan
Key features include:
- Smart Structure Mapping: Automatically detects significant support and resistance levels filtered by ATR-based volatility.
- SGE Scoring Engine: Calculates trend strength by counting breached structural levels.
- Anti-Clutter Display: Shows only the three closest relevant levels to maintain chart clarity.
- Momentum Detection: Uses "Big Candle" logic to highlight moves with institutional backing.
- Customizable sensitivity for different assets such as XAUUSD, EURUSD, GBPUSD, and indices.
The indicator works on all timeframes from 1 minute to monthly, with professional traders typically using H1, H4, or daily charts to identify institutional structure. The dashboard provides a clear bias score and structural levels to guide trade entries and exits. Users are advised to trade with the bias, waiting for price pullbacks to the nearest structure lines before executing trades.
This tool is intended as a directional filter and can be combined with other indicators like RSI. It does not repaint, as calculations are based on confirmed candle closes.
Ulasan pelanggan
5 | 100 % | |
4 | 0 % | |
3 | 0 % | |
2 | 0 % | |
1 | 0 % |