present
Daftar dan dapatkan potongan bernilai $50 untuk pembelian pertama anda
Trading product for WhaleLiquidityProfile Indikator Key Levels Volume, image 1
WhaleLiquidityProfile
Indikator
721 muat turun
Versi 1.0, May 2026
Windows, Mac
5.0
Ulasan: 3
Trading product for WhaleLiquidityProfile Indikator Key Levels Volume, image 2
33
Jualan
737
Pemasangan percuma

Penerangan

Profil Likuiditi & Penyerapan Whale

Jejaki wang institusi, analisis aliran pesanan, dan kenal pasti zon pembalikan dengan ketepatan volumetrik

The Whale Liquidity & Absorption Profile bukan profil volum tradisional anda. Ia adalah suite analisis mikrostruktur pasaran yang memecahkan setiap transaksi untuk menunjukkan kepada anda bukan sahaja di mana volum didagangkan, tetapi siapa yang berdagangnya (institusi vs. runcit) dan bagaimana harga berinteraksi pada tahap tersebut (agresi vs. penyerapan).

Ia menampilkan enjin rendering yang dioptimumkan yang memproyeksikan semua data ke kanan harga semasa, menjadikan carta anda bersih sepenuhnya dan bebas kelewatan.

Ciri-ciri Utama

  • Penapis Kekuatan (Hanya Whale): Menggunakan algoritma peratusan (contoh, 97% teratas) untuk memisahkan volum institusi ("Kuat") daripada volum runcit ("Lemah"). Anda boleh mengaktifkan mod "Kuat Sahaja" untuk menjejaki jejak wang pintar secara eksklusif.
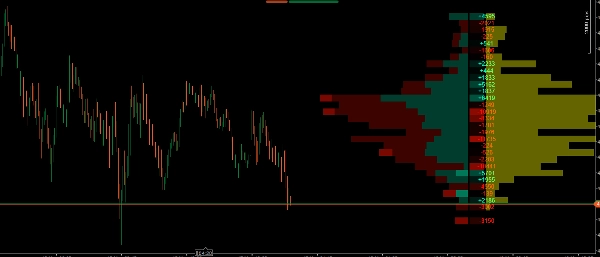
  • Profil Volum Bertindih: Memaparkan secara visual pengagihan volum bullish dan bearish setiap tahap harga, memudahkan untuk mengenal pasti Titik Kawalan (POC) dan Nod Volum Tinggi/Rendah (HVN/LVN).
  • Pengesanan Kawasan Nilai Automatik: Menonjolkan tahap harga di mana peratusan volum tertinggi telah didagangkan (lalai 70%), mengaburkan zon luar untuk memudahkan pembacaan konteks pasaran dengan cepat.
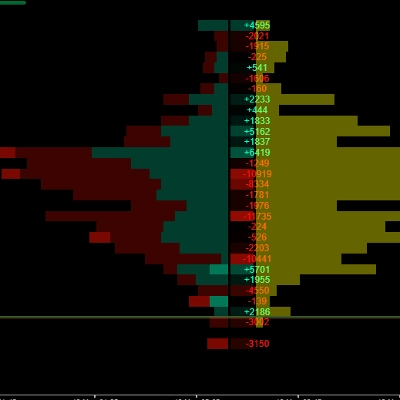
  • Profil Delta (Peta Haba): Mengira perbezaan tepat antara pembelian pasaran dan penjualan pasaran pada setiap tahap harga. Ia termasuk nilai berangka dan peta haba visual untuk mengenal pasti dengan cepat siapa yang mengawal secara agresif.
  • Profil Penyerapan (Zon Kuning): Mengukur volum yang terperangkap khususnya dalam sumbu lilin. Ini membolehkan anda melihat secara grafik di mana wang pintar secara pasif menyerap likuiditi daripada pedagang runcit yang terperangkap.
  • Prestasi Dioptimumkan: Pengiraan volumetrik berat hanya diproses pada lilin terkini, memastikan platform cTrader anda berjalan lancar dan cekap, walaupun pada jangka masa yang lebih rendah.

Bagaimana menggunakan penunjuk ini dalam perdagangan anda?

Penunjuk ini menyediakan 3 lapisan pengesahan untuk perdagangan anda. Berikut adalah cara menggabungkannya dengan berkesan:

1. Tentukan Konteks dengan Profil Volum & Kawasan Nilai

  • Gunakan profil volum untuk mengenal pasti di mana penerimaan harga adalah tertinggi (Kawasan Nilai dan POC).
  • Strategi: Cari peluang membeli di bahagian bawah Kawasan Nilai (Sokongan) dan peluang menjual di bahagian atas Kawasan Nilai (Rintangan).

2. Nilai Agresi dengan Profil Delta

  • Apabila harga mencapai tahap utama anda (contohnya, zon sokongan), lihat pada lajur Delta.
  • Strategi: Jika anda mencari pembelian di sokongan, anda mahu melihat Delta positif yang kuat (hijau) pada tahap itu, menunjukkan pembeli masuk secara agresif. Jika Delta kekal sangat negatif, penjual masih menguasai.

3. Cari Pencetus Sempurna dengan Profil Penyerapan (Teras penunjuk)

  • Di sinilah alat ini benar-benar menonjol. Selalunya, pasaran kelihatan seperti jatuh dengan kuat (Delta negatif yang kuat), tetapi harga berhenti jatuh. Kenapa? Kerana "whale" menggunakan pesanan had untuk menyerap semua tekanan jualan itu.
  • Strategi (Perdagangan Pembalikan): Jika anda melihat harga jatuh ke tahap kritikal dan Delta negatif (penjual runcit terperangkap), tetapi tiba-tiba bar kuning besar muncul dalam Profil Penyerapan, ini bermakna institusi baru sahaja menyerap semua likuiditi dalam sumbu itu. Ini adalah pencetus optimum anda untuk masuk ke arah bertentangan!

4. Gunakan "Penapis Kekuatan" untuk Memotong Bunyi Bising

  • Jika pasaran sedang mengukuh dan arah tidak jelas, hidupkan pilihan "Kuat Sahaja". Ini akan menyembunyikan semua bunyi runcit yang tidak relevan dan menunjukkan dengan tepat di mana dana besar sedang mengumpul atau mengagihkan posisi mereka.

Ringkasan

Ringkasan AI
Whale Liquidity & Absorption Profile is a market microstructure indicator designed for detailed volume and order flow analysis. It distinguishes institutional ("whale") volume from retail activity using a percentile-based Strength Filter, enabling users to focus on smart money footprints. The indicator visually presents a stacked volume profile that separates bullish and bearish volume by price level, highlighting key areas such as the Point of Control (POC) and High/Low Volume Nodes (HVN/LVN). It automatically detects the Value Area, where the majority of volume is concentrated, to provide clear market context.

A Delta Profile heatmap calculates the net difference between market buys and sells at each price level, showing buyer or seller aggression. The Absorption Profile identifies volume trapped in candlestick wicks, revealing where institutional traders absorb liquidity from retail participants. The indicator’s optimized engine processes heavy volumetric calculations only on the latest candle, ensuring smooth performance on the cTrader platform.

Traders can use this tool to define market context, evaluate buying or selling aggression, and pinpoint reversal triggers based on absorption patterns. The "Strong Only" mode filters out retail noise during consolidation phases, focusing on institutional accumulation or distribution zones. This indicator supports volume and DOM data visualization to enhance decision-making around key support and resistance levels.
Profil indikator
Kategori indikator
Volum
Jenis output
Visualisasi
Keperluan data
Volum
DoM

Perbincangan

Ulasan pelanggan

5.0
Ulasan: 3
5
100 %
4
0 %
3
0 %
2
0 %
1
0 %
Ulasan pelanggan
October 16, 2026
Very good; it plots correctly on the chart and helps improve reading and entry decisions.
September 2, 2026
Excelente indicador.
May 21, 2026
Thanks for this sir, the delta and volume are depicted cleanly and accurately on this indicator. With the addition of absortion and filter settings for volume, it beats most in its class.

Soalan Lazim

Key Levels
Volume
Support & Resistance
Produk yang tersedia melalui cTrader Store, termasuk bot dagangan, indikator dan plugin, disediakan oleh pembangun pihak ketiga dan diberikan akses untuk tujuan maklumat dan teknikal sahaja. cTrader Store bukan broker dan tidak memberikan nasihat pelaburan, syor peribadi atau sebarang jaminan prestasi masa hadapan.

Lebih banyak produk daripada penulis ini

Indikator
AI
Prop
+14
Professional Trading Indicator Transform Your Trading with Intelligent Signal Detection RenkoProfit
Indikator
AI
Prop
+9
Phoenix Zones - Detector de Reversiones Críticas
Indikator
Liquidity Grab
Liquidity Sweep
+1
CRT Sweep Tracker is an advanced panel for Candle Range Theory (CRT) traders to track HTF sweeps and manage live trades.
Indikator
ATR
Volume
+2
Heatmap Liquidity Zones Visualize volume-at-price, uncover hidden support/resistance, and track market liquidity in real
Indikator
BOS
CHOCH
+5
Smart Money Concepts Automate your institutional analysis and make decisions with pinpoint precision..
Indikator
AI-assisted
Predictive Monte Carlo Engine Forecast future price paths using institutional-grade statistical models and probability
Indikator
BOS
VWAP
+4
Gold premiun XAUUSD Exclusive Real-Time Adaptive Intelligence
Indikator
Prop
Forex
+10
Heatmap Pro analiza la volatilidad, el volumen y la acción del precio para "pintar" tu gráfico con zonas de color.
Logo "Candlehtf"
Dinilai teratas
4.2
(4)
$19
/
$20
Indikator
SMC
Forex
+13
MultiFrameCandles para cTrader: La Herramienta Definitiva para Dominar Cualquier Marco de Tiempo
Indikator
Forex
BTCUSD
+11
Catch High-Probability Reversals with Precision Swing
Indikator
MSS
Market Structure
NY HTF Candles is a precision panel designed specifically for institutional traders
Logo "ReversalGuard"
Dinilai teratas
4.5
(4)
$19
Indikator
ReversalGuard Pro: Domina el Mercado con Zonas de Soporte y Resistencia de Alta Precisión"

Anda juga mungkin suka

Indikator
VWAP
Volume
+5
Multi VWAP. Three timeframes. One clean chart. Your Essential Trading Tool.
Indikator
EMA
AI-assisted
+1
Multi EMA Timeframes lets you stay on your chart and see the exact EMA from any timeframe you choose — up to 5 at once.
Indikator
Forex
Crypto
+5
📈 Initial Balance Breakout Signals: visually accurate IB levels, breakout alerts & forecast zones for smart trading.
Indikator
SMC
Prop
+14
an all-in-one Smart Money Concepts (SMC) toolkit featuring Premium/Discount zones.
Indikator
Forex
Crypto
+3
PnL dashboard with per‑asset exposure, win‑rate, and spread % with dynamic colors.
Indikator
Drawdown Monitor
Protect your funded account. Real-time Daily Equity Drawdown monitor with Green / Orange / Red flashing alerts.
Indikator
Key Levels
Liquidity Grab
+2
The levels you mark each morning, drawn and followed: PDH/PDL, weekly, monthly, sessions, equal highs/lows.
Indikator
Prop
Forex
+11
🌊 See when the market is truly in play. Tsunami measures Relative Volume by time-of-day 🌊
Indikator
ATR
BOS
+5
Market structure with BOS and CHoCH, order blocks, and retest buy/sell arrows with entry, stop and two targets
Indikator
Signal
🔹 Trend-Reversal-Indicator for cTrader 🔹 The ultimate Renko chart tool!
Indikator
AI
SMC
+14
Refined cleaner version of Key Levels indicator with broker UTC offset, styles & label alignment.
Indikator
Fibonacci
Key Levels
+1
Explore Elliott wave counts, three swing sizes and example levels with an interactive cTrader chart panel.
Indikator
Volume
Fibonacci
+3
Draw and manage multiple fixed-range volume profiles with persistent levels, developing POC/VA and smart alerts.
Indikator
MACD
Forex
+5
🚀 MACD Pro Trader – Advanced MACD with buy/sell signals, custom MAs & color-coded histograms for smarter trading! 📈🔥
Indikator
Prop
Forex
+11
😎Read the description before purchasing💩
Indikator
ATR
RSI
+4
Adaptive Ichimoku with nine-factor confluence scoring, five signal types, smart TP/SL and an MTF panel.
Indikator
SMC
Forex
+1
Visualize Asia session range with customizable lines for high, low, mid, start, and end.
Indikator
RSI
MACD
+7
The ZigZag indicator is a technical analysis tool primarily used to identify key price reversal points.

Harga

33
Jualan
737
Pemasangan percuma