คำอธิบาย
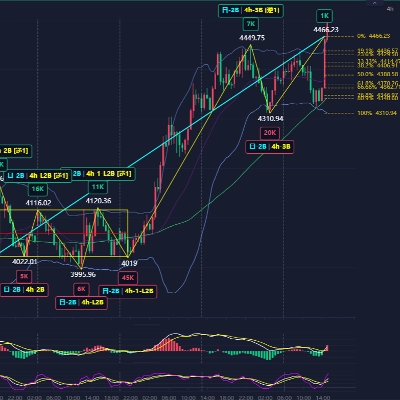
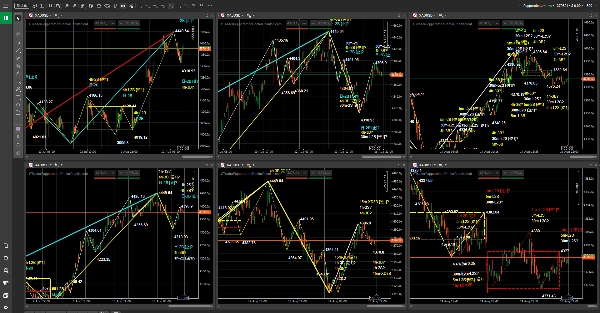
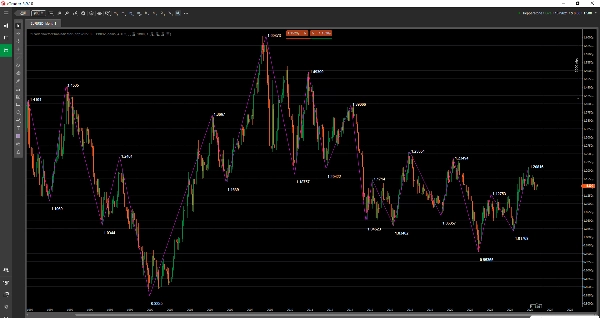
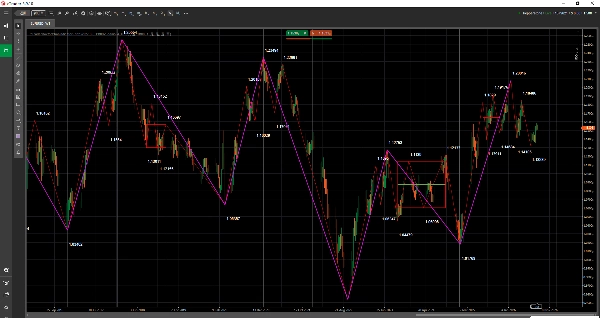
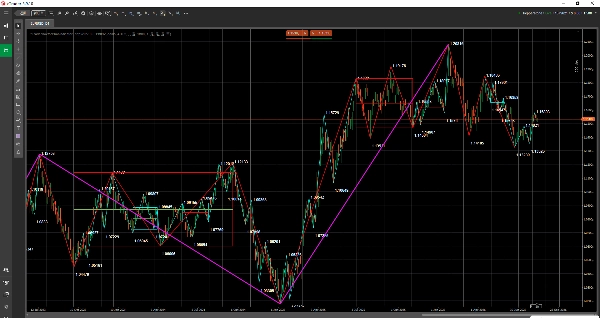
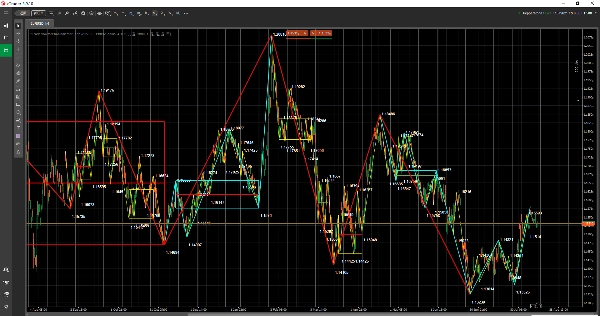
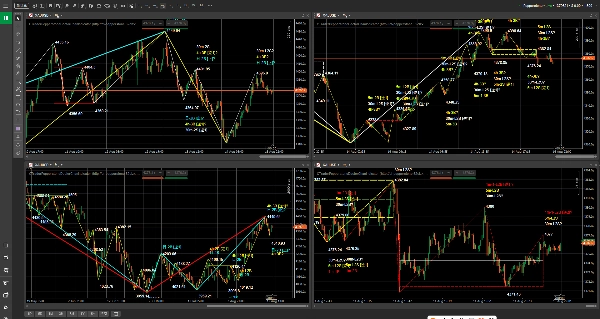
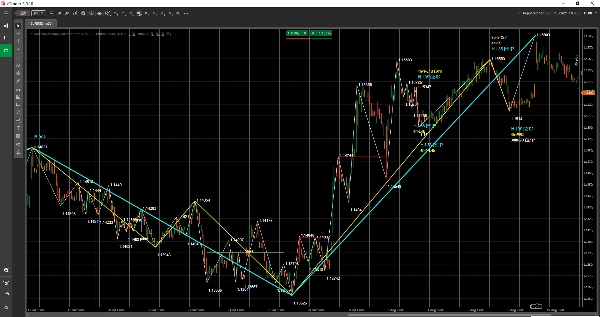
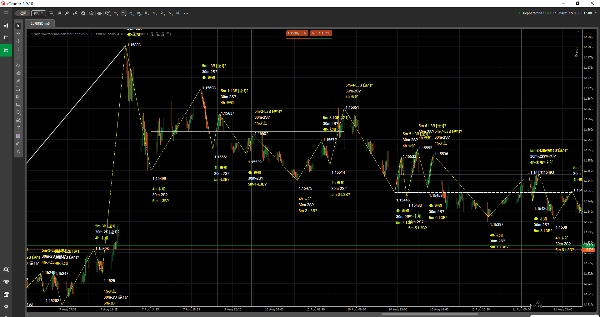
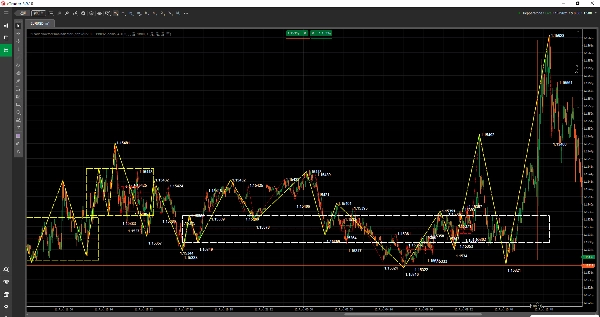
ดร. ชานลุน สตรัคเจอร์ อินดิเคเตอร์ สำหรับ cTrader เป็นตัวชี้วัดการวิเคราะห์ทางเทคนิคแบบโครงสร้างตลาด / ซ้อนกราฟที่ใช้แสดงโครงสร้างชานลุนบนกราฟ cTrader
เหมาะสำหรับเทรดเดอร์ที่เน้นการเคลื่อนไหวของราคา โครงสร้างแนวโน้ม และการวิเคราะห์หลายกรอบเวลา ตัวชี้วัดจะแสดงโครงสร้างชานลุนสำคัญในรูปแบบวัตถุกราฟ รวมถึงโครงสร้าง Bi โซน Zhongshu เครื่องหมายซื้อ/ขาย และอื่นๆ ช่วยให้ผู้ใช้สังเกตจังหวะตลาด การเปลี่ยนแปลงโครงสร้าง และความสัมพันธ์ระหว่างกรอบเวลาต่างๆ ได้อย่างชัดเจนขึ้น
ตัวชี้วัดนี้ไม่ใช่หุ่นยนต์เทรดอัตโนมัติและไม่ใช่บริการสัญญาณการเทรด จุดประสงค์คือช่วยให้ผู้ใช้สามารถอ่านกราฟ ทบทวนตลาด และวางแผนการเทรดได้ชัดเจนยิ่งขึ้น
เวอร์ชันปัจจุบันรองรับสัญลักษณ์และกรอบเวลาที่ระบุของ Pepperstone cTrader ผลิตภัณฑ์นี้เป็นตัวชี้วัดอิสระจากบุคคลที่สาม ไม่ใช่ผลิตภัณฑ์อย่างเป็นทางการของ Pepperstone หรือผลิตภัณฑ์พันธมิตรของ Pepperstone
ภาพรวมตัวชี้วัด
- ประเภทตัวชี้วัด: ตัวชี้วัดโครงสร้างตลาด / ซ้อนกราฟ
- เครื่องมือที่แนะนำ: สัญลักษณ์ Forex, ดัชนี, สินค้าโภคภัณฑ์, สกุลเงินดิจิทัล และ CFD หุ้นที่ระบุใน Pepperstone cTrader
- กรอบเวลาที่แนะนำ: 1 นาที, 5 นาที, 15 นาที, 30 นาที, 1 ชั่วโมง, 4 ชั่วโมง, รายวัน, รายสัปดาห์ และรายเดือน
- กรณีการใช้งานเทรด: การสังเกตโครงสร้างกราฟ, การวิเคราะห์หลายกรอบเวลา, การเตรียมแผนการเทรด และการสนับสนุนการทบทวน
สิ่งที่คุณจะเห็นบนกราฟ
- โครงสร้าง Bi: ใช้สังเกตจังหวะสวิงและความก้าวหน้าของโครงสร้าง
- โซน Zhongshu: ใช้สังเกตพื้นที่รวมตัวสำคัญ สมดุล และการทับซ้อนของโครงสร้าง
- เครื่องหมายซื้อ/ขาย: ช่วยหาจุดอ้างอิงโครงสร้างสำคัญ
- ป้ายข้อความ เส้นแนวนอน เส้นแนวตั้ง พื้นที่สี่เหลี่ยม เส้นแนวโน้ม และวัตถุกราฟอื่นๆ
- รองรับการจับคู่ข้อมูลอัตโนมัติกับกรอบเวลาปัจจุบันของกราฟ ทำให้การสังเกตหลายกรอบเวลาง่ายขึ้น
ตัวชี้วัดนี้เหมาะสำหรับใคร
- ผู้ใช้ที่กำลังเรียนรู้หรือใช้ Dr. Chanlun Structure Indicator และการวิเคราะห์โครงสร้างชานลุน
- ผู้ใช้ที่ต้องการดูข้อมูลโครงสร้างโดยตรงบนกราฟ cTrader
- ผู้ใช้ที่ใช้ Pepperstone เพื่อดู Forex, ดัชนี, สินค้าโภคภัณฑ์, สกุลเงินดิจิทัล หรือ CFD หุ้น
- เทรดเดอร์ที่ต้องการเปรียบเทียบโครงสร้างแนวโน้มในกรอบเวลาต่างๆ
- ผู้ใช้ที่ต้องการทำให้กระบวนการอ่านกราฟ วางแผน และทบทวนชัดเจนขึ้น
การเข้าถึงและการอนุญาตใช้งาน
การเข้าถึงและการอนุญาตใช้งานผลิตภัณฑ์ถูกจัดการผ่านกระบวนการซื้อ ทดลอง และติดตั้งใน cTrader Store โปรดดูสถานะการซื้อ สถานะการทดลอง และข้อมูลผลิตภัณฑ์ที่แสดงบนหน้าผลิตภัณฑ์ใน cTrader Store
สัญลักษณ์ Pepperstone ที่รองรับในปัจจุบัน
Forex:
GBPUSD, EURUSD, USDJPY, USDCHF, AUDUSD, USDCAD, GBPJPY
ดัชนี:
US500, NAS100, GER40, UK100, JPN225, VIX, HSTECH
สินค้าโภคภัณฑ์:
XAUUSD, XAGUSD
สกุลเงินดิจิทัล:
BTCUSD, ETHUSD
หุ้น:
AAPL.US-24, MSFT.US-24, GOOG.US-24, AMZN.US-24, TSLA.US-24, NVDA.US-24, META.US-24, NFLX.US-24, JPM.US-24
กรอบเวลาที่รองรับ
1 นาที, 5 นาที, 15 นาที, 30 นาที, 1 ชั่วโมง, 4 ชั่วโมง, รายวัน, รายสัปดาห์ และรายเดือน
ขั้นตอนการทำงานที่แนะนำ
1. เปิดกราฟสำหรับสัญลักษณ์ที่รองรับในสภาพแวดล้อม Pepperstone cTrader
2. โหลด Dr. Chanlun Structure Indicator ลงบนกราฟ
3. เวลาข้อมูลของ Dr. Chanlun Structure Indicator เป็น UTC+0 เมื่อตรวจสอบโครงสร้างกราฟ ให้เปลี่ยนโซนเวลาของกราฟ cTrader เป็นโซนเวลาที่สอดคล้องก่อนเปรียบเทียบตำแหน่ง
4. ตรวจสอบให้แน่ใจว่ากรอบเวลาปัจจุบันของกราฟได้รับการรองรับ ตัวชี้วัดจะจับคู่ข้อมูลกับกรอบเวลากราฟโดยอัตโนมัติ
5. เปิดหรือปิด "Show Bi", "Show Zhongshu" และ "Show Buy/Sell" ตามความต้องการ
6. สังเกตโครงสร้างกราฟควบคู่กับแผนการเทรด การจัดการตำแหน่ง และการควบคุมความเสี่ยงของคุณเอง
การตั้งค่าพารามิเตอร์
เวอร์ชันปัจจุบันเปิดเผยเพียง 3 พารามิเตอร์ที่มองเห็นได้ในแผงตัวชี้วัด cTrader เท่านั้น กรอบเวลาข้อมูล, คำต่อท้ายสัญลักษณ์โบรกเกอร์, แคช, การรีเฟรช, การถ่ายโอนแบบบีบอัด และการตั้งค่าการบันทึกจะถูกจัดการภายในโดยตัวชี้วัดและไม่จำเป็นต้องตั้งค่าสำหรับการใช้งานปกติ
Show Bi
ค่าเริ่มต้น: "true"
ว่าจะให้แสดงโครงสร้าง Bi หรือไม่
Show Zhongshu
ค่าเริ่มต้น: "true"
ว่าจะให้แสดงโซน Zhongshu หรือไม่
Show Buy/Sell
ค่าเริ่มต้น: "true"
ว่าจะให้แสดงเครื่องหมายซื้อ/ขายหรือไม่
หมายเหตุสำคัญ
- ผลิตภัณฑ์นี้เป็นตัวช่วยวิเคราะห์ทางเทคนิค ไม่ใช่หุ่นยนต์เทรดอัตโนมัติ
- ตัวชี้วัดไม่ทำการสั่งซื้อขายโดยอัตโนมัติ
- ตัวชี้วัดนี้ไม่ใช่คำแนะนำการลงทุน บริการสัญญาณการเทรด หรือการรับประกันผลกำไร
- เวอร์ชันปัจจุบันรองรับเฉพาะสัญลักษณ์และกรอบเวลาที่ระบุของ Pepperstone cTrader เท่านั้น
- เวลาข้อมูลของ Dr. Chanlun Structure Indicator เป็น UTC+0 เมื่อนำไปแสดงบนกราฟ cTrader โปรดเปลี่ยนโซนเวลาของกราฟให้ตรงกันก่อนตรวจสอบตำแหน่งโครงสร้าง
- ผู้ใช้ควรใช้ควบคู่กับแผนการเทรด การจัดการตำแหน่ง การควบคุมความเสี่ยง และการตัดสินใจอย่างอิสระของตนเอง
ทิศทางการอัปเดตในอนาคต
เวอร์ชันที่ปล่อยในปัจจุบันเน้นสัญลักษณ์และกรอบเวลาที่ระบุของ Pepperstone cTrader การอัปเดตในอนาคตอาจขยายไปยังโบรกเกอร์อื่นๆ การจับคู่สัญลักษณ์เพิ่มเติม และขอบเขตบริการข้อมูลที่ครบถ้วนมากขึ้นตามแผนผลิตภัณฑ์
คำเตือนความเสี่ยง
การเทรดในตลาดการเงินมีความเสี่ยง ผลการดำเนินงานในอดีตไม่รับประกันผลลัพธ์ในอนาคต ตัวชี้วัดนี้เป็นเพียงเครื่องมือช่วยวิเคราะห์ทางเทคนิคและการเรียนรู้เท่านั้น ไม่ใช่คำแนะนำการลงทุน บริการสัญญาณการเทรด หรือการรับประกันผลกำไร โครงสร้างในอดีตไม่ได้แสดงถึงผลลัพธ์ในอนาคต ผู้ใช้ควรทดสอบอย่างเต็มที่ในสภาพแวดล้อมการเทรดของตนเองและใช้อย่างระมัดระวังควบคู่กับกฎการจัดการความเสี่ยง
สรุป
This tool is intended for traders focusing on price action, trend structure, and multi-timeframe analysis. It supports automatic data matching to the current chart timeframe, facilitating easier multi-timeframe observation. Users can toggle the display of Bi structures, Zhongshu zones, and buy/sell markers according to their preferences.
Dr. Chanlun Structure is a technical analysis assistant and does not provide automated trading or trading signals. It requires users to apply their own trading plans, risk management, and judgment. The indicator is compatible with specified Pepperstone cTrader symbols and timeframes and uses UTC+0 data time, requiring appropriate chart timezone settings for accurate structure alignment.