Descrição
O Indicador de Estrutura Boshi Chanlun para cTrader é um indicador de análise técnica de estrutura de mercado / sobreposição de gráfico usado para exibir estruturas Chanlun nos gráficos do cTrader.
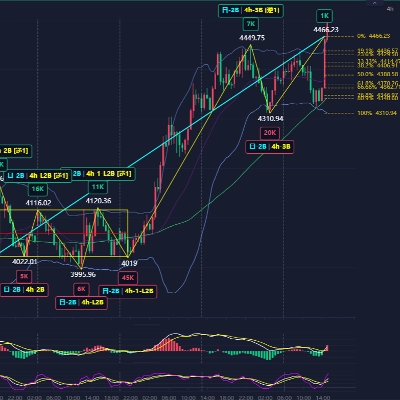
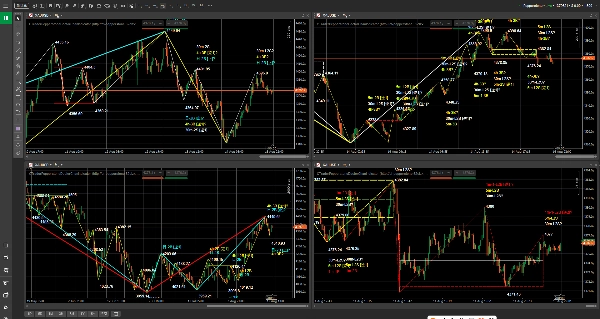
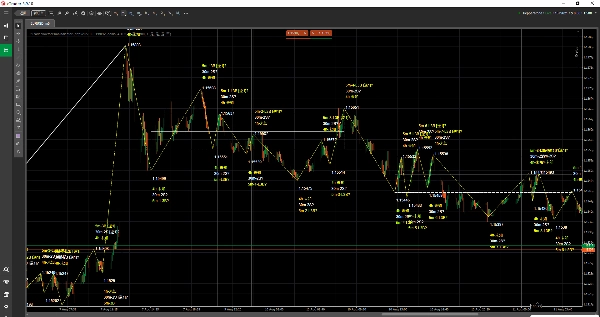
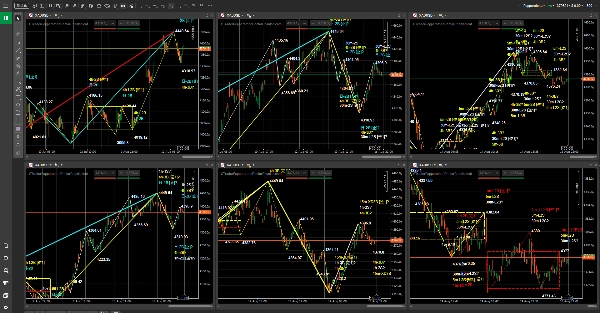
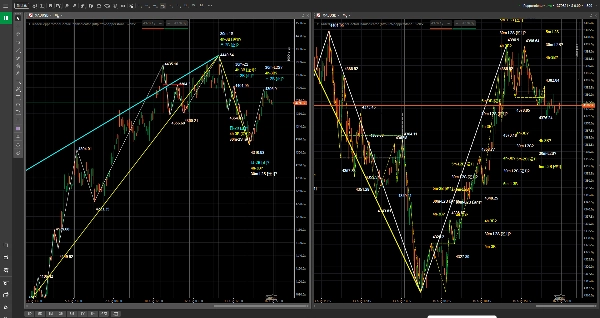
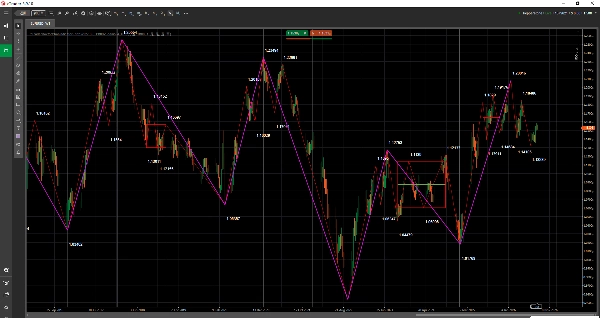
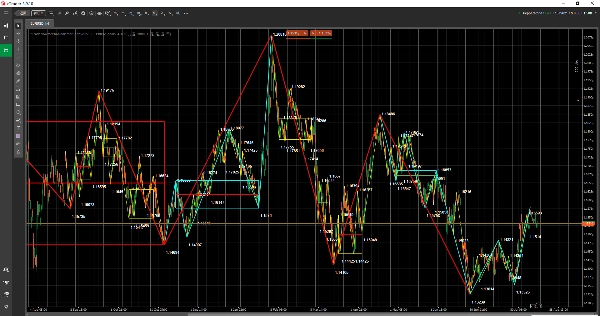
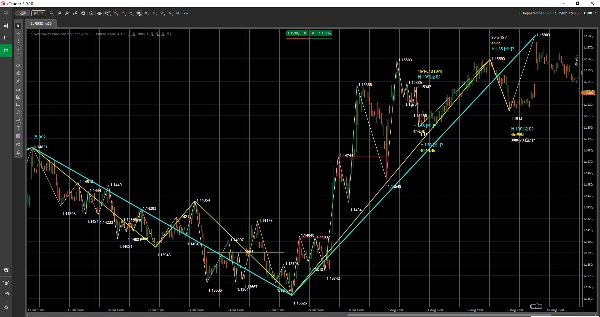
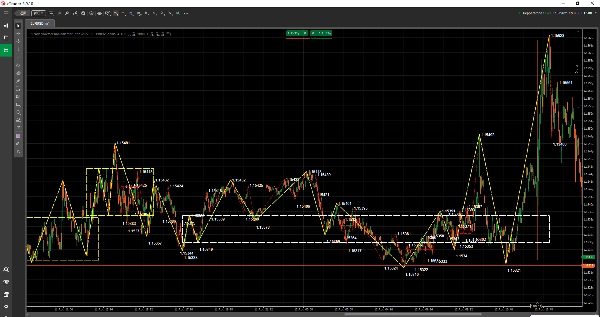
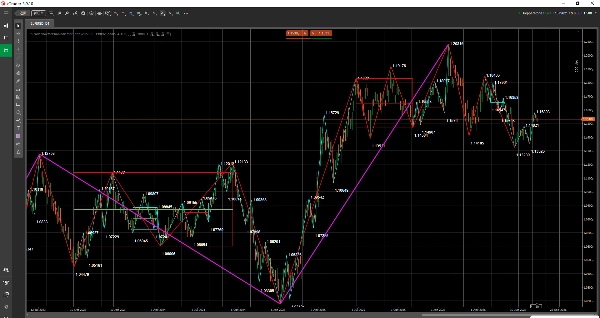
É adequado para traders que focam em ação de preço, estrutura de tendência e análise multitemporal. O indicador exibe estruturas Chanlun chave como objetos no gráfico, incluindo estruturas Bi, zonas Zhongshu, marcadores de compra/venda e mais, ajudando os usuários a observar o ritmo do mercado, mudanças estruturais e relações entre diferentes timeframes de forma mais intuitiva.
Este indicador não é um robô de negociação automatizado e não é um serviço de sinal de negociação. Seu propósito é ajudar os usuários a ler gráficos, revisar mercados e construir planos de negociação de forma mais clara.
A versão atual é compatível com símbolos e timeframes especificados da Pepperstone cTrader. Este produto é um indicador independente de terceiros e não é um produto oficial da Pepperstone nem um produto parceiro da Pepperstone.
Visão geral do indicador
- Tipo de indicador: indicador de estrutura de mercado / sobreposição de gráfico.
- Instrumentos preferidos: símbolos especificados de Forex, índices, commodities, criptomoedas e CFDs de ações na Pepperstone cTrader.
- Timeframes preferidos: 1 minuto, 5 minutos, 15 minutos, 30 minutos, 1 hora, 4 horas, diário, semanal e mensal.
- Caso de uso para negociação: observação da estrutura do gráfico, análise multitemporal, preparação de plano de negociação e suporte à revisão.
O que você pode ver no gráfico
- Estruturas Bi: usadas para observar o ritmo dos swings e a progressão estrutural.
- Zonas Zhongshu: usadas para observar áreas importantes de consolidação, equilíbrio e sobreposição estrutural.
- Marcadores de compra/venda: usados para ajudar a localizar pontos de referência estrutural chave.
- Etiquetas de texto, linhas horizontais, linhas verticais, áreas retangulares, linhas de tendência e outros objetos de gráfico.
- A correspondência automática de dados com o timeframe atual do gráfico é suportada por padrão, facilitando a observação multitemporal.
Para quem é este indicador
- Usuários que estão aprendendo ou usando o Indicador de Estrutura Boshi Chanlun e análise de estrutura Chanlun.
- Usuários que desejam visualizar informações de estrutura diretamente nos gráficos do cTrader.
- Usuários que usam Pepperstone para visualizar Forex, índices, commodities, criptomoedas ou CFDs de ações.
- Traders que precisam comparar estruturas de tendência entre diferentes timeframes.
- Usuários que querem tornar os fluxos de trabalho de leitura de gráfico, planejamento e revisão mais claros.
Acesso e licenciamento
O acesso ao produto e o licenciamento são gerenciados através do processo de compra, teste e instalação na cTrader Store. Por favor, consulte o status da compra, status do teste e informações do produto mostradas na página do produto na cTrader Store.
Símbolos Pepperstone atualmente suportados
Forex:
GBPUSD, EURUSD, USDJPY, USDCHF, AUDUSD, USDCAD, GBPJPY
Índices:
US500, NAS100, GER40, UK100, JPN225, VIX, HSTECH
Commodities:
XAUUSD, XAGUSD
Criptomoedas:
BTCUSD, ETHUSD
Ações:
AAPL.US-24, MSFT.US-24, GOOG.US-24, AMZN.US-24, TSLA.US-24, NVDA.US-24, META.US-24, NFLX.US-24, JPM.US-24
Timeframes suportados
1 minuto, 5 minutos, 15 minutos, 30 minutos, 1 hora, 4 horas, diário, semanal e mensal.
Fluxo de trabalho sugerido
1. Abra um gráfico para um símbolo suportado no ambiente Pepperstone cTrader.
2. Carregue o Indicador de Estrutura Boshi Chanlun no gráfico.
3. O tempo dos dados do Indicador de Estrutura Boshi Chanlun é UTC+0. Ao verificar estruturas no gráfico, certifique-se de mudar o fuso horário do gráfico cTrader para o fuso horário correspondente antes de comparar posições.
4. Certifique-se de que o timeframe atual do gráfico é suportado. O indicador combina automaticamente os dados com o timeframe do gráfico.
5. Ative ou desative "Mostrar Bi", "Mostrar Zhongshu" e "Mostrar Compra/Venda" conforme necessário.
6. Observe a estrutura do gráfico junto com seu próprio plano de negociação, gerenciamento de posições e controle de risco.
Configurações de parâmetros
A versão atual expõe apenas os seguintes 3 parâmetros visíveis no painel do indicador cTrader. Timeframe dos dados, sufixo do símbolo do corretor, cache, atualização, transferência comprimida e configurações de registro são gerenciados internamente pelo indicador e não precisam ser configurados para uso normal.
Mostrar Bi
Valor padrão: "true"
Se deve exibir as estruturas Bi.
Mostrar Zhongshu
Valor padrão: "true"
Se deve exibir as zonas Zhongshu.
Mostrar Compra/Venda
Valor padrão: "true"
Se deve exibir os marcadores de compra/venda.
Notas importantes
- Este produto é um indicador assistente de análise técnica, não um robô de negociação automatizado.
- O indicador não realiza ordens automaticamente.
- O indicador não constitui aconselhamento de investimento, serviço de sinal de negociação ou garantia de lucro.
- A versão atual é compatível apenas com símbolos Pepperstone cTrader especificados e timeframes especificados.
- O tempo dos dados do Indicador de Estrutura Boshi Chanlun é UTC+0. Ao exibi-lo em um gráfico cTrader, por favor, mude para o fuso horário correspondente do gráfico antes de verificar as posições da estrutura.
- Os usuários devem usá-lo junto com seu próprio plano de negociação, gerenciamento de posições, controle de risco e julgamento independente.
Direção de atualização futura
A versão atual prioriza símbolos e timeframes especificados da Pepperstone cTrader. Atualizações futuras podem continuar a expandir mais corretores, mais mapeamentos de símbolos e um escopo de serviço de dados mais completo conforme o plano do produto.
Aviso de risco
Negociar nos mercados financeiros envolve risco. Desempenho passado não garante resultados futuros. Este indicador é apenas uma ferramenta de análise técnica e assistente de aprendizado. Não constitui aconselhamento de investimento, serviço de sinal de negociação ou garantia de lucro. Estruturas históricas não representam resultados futuros. Os usuários devem testá-lo completamente em seu próprio ambiente de negociação e usá-lo com cuidado junto com regras de gerenciamento de risco.
Resumo
Compatible with selected Forex pairs (e.g., GBPUSD, EURUSD), indices (e.g., US500, NAS100), commodities (XAUUSD, XAGUSD), cryptocurrencies (BTCUSD, ETHUSD), and major US stock CFDs (e.g., AAPL, MSFT, TSLA), it automatically matches data to the current chart timeframe. Users can toggle the display of Bi structures, Zhongshu zones, and buy/sell markers via simple parameters.
This indicator serves as a chart reading and market review assistant, not an automated trading system or signal provider. It requires users to apply their own trading plans, risk management, and judgment. Data time is based on UTC+0, so chart time zone adjustments are necessary for accurate structure positioning. Access and licensing are managed through the cTrader Store.
Avaliações de clientes
5 | 0 % | |
4 | 100 % | |
3 | 0 % | |
2 | 0 % | |
1 | 0 % |