Penerangan
strategi SuperTrend**
Strategi **SuperTrend** adalah strategi perdagangan popular berdasarkan penunjuk teknikal yang sama namanya (**Penunjuk SuperTrend**). Penunjuk ini digunakan untuk mengenal pasti tren pasaran (tren menaik atau tren menurun) dan memberikan isyarat masuk dan keluar yang jelas. Ia terkenal kerana kesederhanaan dan keberkesanannya dalam pasaran yang sedang tren.
---
### **Komponen Penunjuk SuperTrend**
1. **Purata Julat Benar (ATR)**:
- Digunakan untuk mengukur volatiliti pasaran.
- Semakin tinggi volatiliti, semakin tinggi nilai ATR.
2. **Pengganda**:
- Faktor yang didarab dengan nilai ATR untuk menentukan jarak garis SuperTrend dari harga.
- Nilai lalai biasanya antara 2 dan 4.
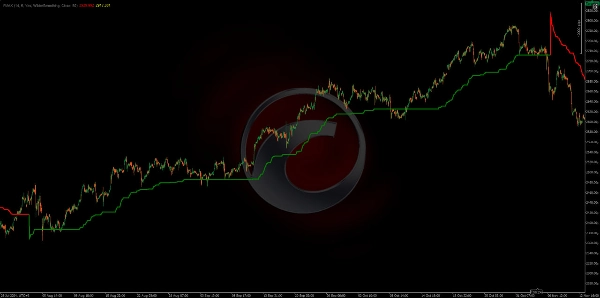
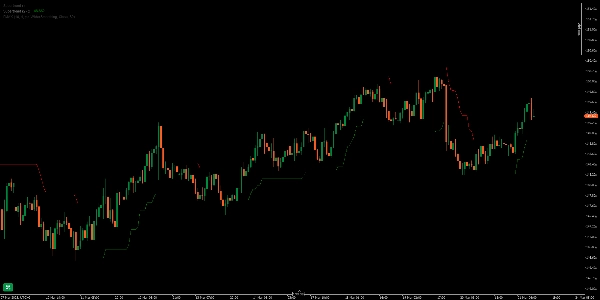
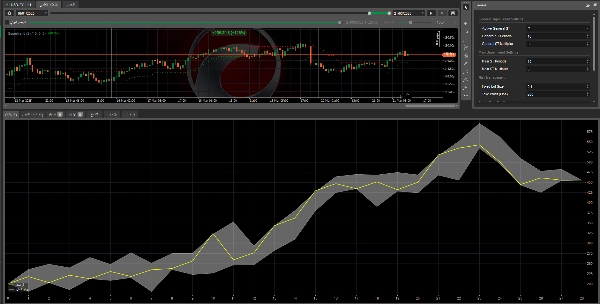
3. **Garis SuperTrend**:
- Garis dinamik yang menyesuaikan berdasarkan pergerakan harga.
- Jika harga berada di atas garis, tren dianggap menaik.
- Jika harga berada di bawah garis, tren dianggap menurun.
---
### **Bagaimana Penunjuk SuperTrend Berfungsi?**
1. **Tren Menaik**:
- Apabila harga berada di atas garis SuperTrend, tren dianggap menaik.
- Garis dilukis di bawah harga, bertindak sebagai sokongan dinamik.
- Isyarat Beli: Apabila harga melintasi di atas garis SuperTrend.
2. **Tren Menurun**:
- Apabila harga berada di bawah garis SuperTrend, tren dianggap menurun.
- Garis dilukis di atas harga, bertindak sebagai rintangan dinamik.
- Isyarat Jual: Apabila harga melintasi di bawah garis SuperTrend.
---
### **Tetapan Penunjuk**
- **Tempoh ATR**: Biasanya ditetapkan kepada 10 (boleh disesuaikan mengikut jangka masa).
- **Pengganda**: Biasanya ditetapkan kepada 3 (boleh disesuaikan untuk meningkatkan atau mengurangkan kepekaan).
---
### **Kelebihan Strategi SuperTrend**
1. **Mudah Digunakan**: Penunjuk ini ringkas dan memberikan isyarat yang jelas.
2. **Berkesan dalam Pasaran Bertren**: Berfungsi dengan baik dalam pasaran yang mempunyai tren kuat.
3. **Titik Masuk dan Keluar yang Jelas**: Memberikan isyarat tepat untuk memasuki dan keluar perdagangan.
4. **Boleh Disesuaikan**: Tempoh ATR dan pengganda boleh disesuaikan mengikut gaya perdagangan anda.
---
### **Kekurangan Strategi SuperTrend**
1. **Tidak Berkesan dalam Pasaran Berjangka**:
- Dalam pasaran mendatar atau berjangka, penunjuk mungkin menghasilkan isyarat palsu.
2. **Isyarat Tertinggal**:
- Seperti kebanyakan penunjuk pengikut tren, ia mungkin tertinggal semasa pergerakan harga yang pantas.
---
### **Cara Menggunakan SuperTrend dalam Perdagangan**
1. **Tambah Penunjuk ke Carta Anda**:
- Tambah penunjuk SuperTrend ke carta anda.
- Laraskan tempoh ATR dan pengganda mengikut keutamaan anda.
2. **Isyarat Beli**:
- Apabila harga melintasi di atas garis SuperTrend dan garis bertukar hijau, ia adalah isyarat beli.
- Letakkan stop-loss di bawah garis SuperTrend.
3. **Isyarat Jual**:
- Apabila harga melintasi di bawah garis SuperTrend dan garis bertukar merah, ia adalah isyarat jual.
- Letakkan stop-loss di atas garis SuperTrend.
4. **Pengurusan Perdagangan**:
- Gunakan garis SuperTrend sebagai panduan untuk keluar dari perdagangan.
- Tutup perdagangan apabila penunjuk berubah arah.
---
### **Petua untuk Meningkatkan Prestasi**
1. **Gabungkan dengan Alat Lain**:
- Gabungkan SuperTrend dengan penunjuk lain seperti **Purata Pergerakan** atau **RSI** untuk mengesahkan isyarat.
2. **Laraskan Berdasarkan Jangka Masa**:
- Gunakan tetapan berbeza untuk jangka masa harian dan yang lebih pendek.
3. **Pengurusan Risiko**:
- Sentiasa gunakan tahap stop-loss dan take-profit untuk mengurangkan kerugian.
---
### **Kesimpulan**
Strategi SuperTrend adalah alat yang kuat dan berkesan untuk mengenal pasti tren dan menghasilkan isyarat perdagangan yang jelas. Walau bagaimanapun, ia harus digunakan dengan berhati-hati dan digabungkan dengan alat lain untuk meningkatkan ketepatan. Strategi ini sesuai untuk pedagang yang lebih suka berdagang dalam pasaran yang mempunyai tren kuat.