Descripción
TRB — Indicador Tick Runs Bars
Detecta Información del Mercado Antes de que el Precio se Mueva
Precio introductorio por tiempo limitado para adoptantes tempranos - asegura tu copia ahora a una tarifa reducida antes de que el precio aumente al precio minorista estándar una vez que finalice el período de lanzamiento inicial.
Versión 1.1
Usa la sección de comentarios para pedir más detalles
Disponible para sesión de video con guía de configuración después de la compra
INDICADOR TICK RUNS BARS (TRB)
Tick Runs Bars amplía el análisis de la microestructura del mercado al detectar la persistencia direccional en el flujo de operaciones. También basado en Advances in Financial Machine Learning de Marcos López de Prado, este indicador identifica cuándo la presión del mercado unilateral se desvía de los niveles esperados — revelando el fraccionamiento de órdenes institucionales y la actividad comercial coordinada.
La Idea Central
Los traders institucionales ejecutan grandes órdenes estratégicamente — las dividen en partes más pequeñas, ocultan volumen detrás de órdenes iceberg o usan ejecución algorítmica para evitar mover el mercado. Estas tácticas dejan huellas distintivas en forma de corridas persistentes de trading unidireccional. Tick Runs Bars detecta estos patrones midiendo cuánto tiempo un lado domina el flujo de órdenes, revelando cuándo ocurre una orden agresiva y deliberada en lugar de fluctuaciones aleatorias de precio.
Cómo Funciona
El indicador calcula la duración de los volúmenes de corridas de compra y corridas de venta por separado — sin netearlos entre sí como las métricas tradicionales de desequilibrio. Rastrea la máxima acumulación de volumen unilateral (θT) contra un umbral esperado dinámico derivado de la probabilidad histórica de compra/venta y volúmenes promedio. Cuando las corridas direccionales reales superan las expectativas, se activa una nueva barra TRB. Esto revela la "forma estructural" de la ejecución del flujo de órdenes — la firma de los jugadores institucionales en acción.
Características Clave
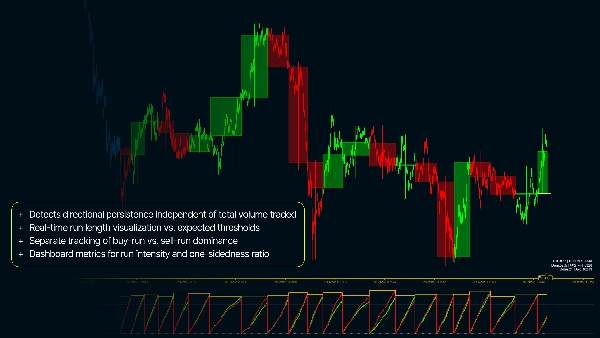
- Detecta persistencia direccional independiente del volumen total negociado
- Visualización en tiempo real de la duración de corridas vs. umbrales esperados
- Seguimiento separado del dominio de corridas de compra vs. corridas de venta
- Coloreado de velas en el gráfico por membresía TRB mostrando fases de ejecución de órdenes
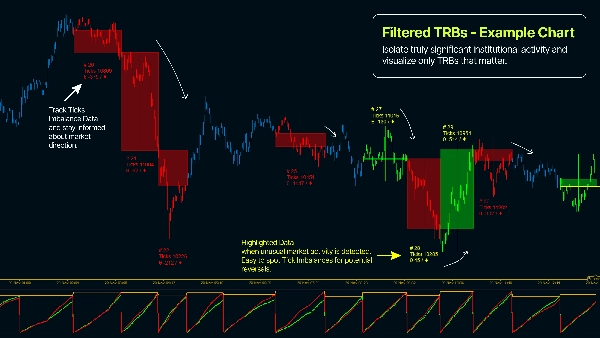
- Filtro de volumen mínimo para aislar actividad institucional verdaderamente significativa
- Métricas en el panel para intensidad de corridas y ratio de unilateralidad
- Parámetros configurables de tamaño esperado de barra y EWMA adaptados a la volatilidad del instrumento
¿Por Qué Usar Tick Runs Bars?
- Identifica la ejecución de órdenes institucionales en tiempo real — antes de su finalización
- Detecta liquidez oculta y patrones de órdenes iceberg mediante análisis de flujo
- Distingue el trading coordinado del ruido aleatorio del mercado
- Captura movimientos de precio por desequilibrios estructurales de órdenes, no solo anomalías estadísticas
- Temporiza entradas/salidas durante períodos de participación institucional conocida
- Aplica teoría avanzada de microestructura de mercado para obtener ventaja en marcos temporales más rápidos
- Reduce señales falsas de picos menores de trading minorista


![Logotipo de "[Stellar Strategies] Smart ADX"](https://cdn.ctrader.com/image/webp/af13b084-b6f6-41db-b7bc-c7e688b57b05_36929)


![Logotipo de "Smart Money Concepts (SMC) [Iridio Capital]"](https://cdn.ctrader.com/image/webp/28b69fd1-ef54-4bed-9487-07e78e883be4_40934)


