present
Sign up and get $50 off your first purchase
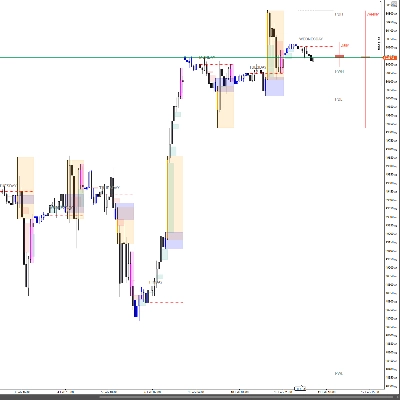
Trading product for KamacycleIndicatorV2 Indicator Premium/Discount  Supply & Demand, image 1
KamacycleIndicatorV2
Indicator
Version 1.0, Oct 2026
Windows, Mac
Trading product for KamacycleIndicatorV2 Indicator Premium/Discount  Supply & Demand, image 2
Trading product for KamacycleIndicatorV2 Indicator Premium/Discount  Supply & Demand, image 3
Trading product for KamacycleIndicatorV2 Indicator Premium/Discount  Supply & Demand, image 4
Trading product for KamacycleIndicatorV2 Indicator Premium/Discount  Supply & Demand, image 5
Trading product for KamacycleIndicatorV2 Indicator Premium/Discount  Supply & Demand, image 6
Trading product for KamacycleIndicatorV2 Indicator Premium/Discount  Supply & Demand, image 7
Trading product for KamacycleIndicatorV2 Indicator Premium/Discount  Supply & Demand, image 8
Since 12/06/2026

Description

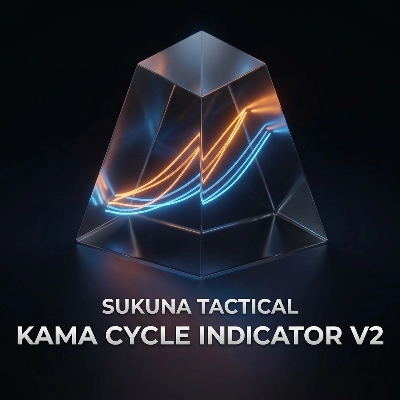
### πŸš€ SukunaTactical - KAMA Cycle Indicator v2


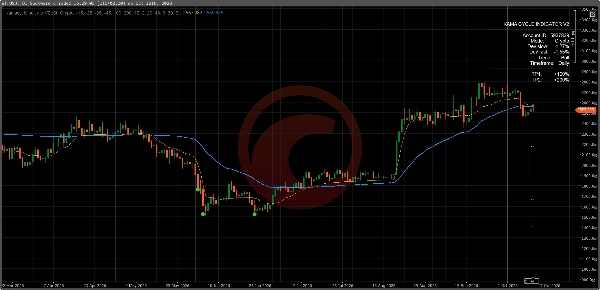
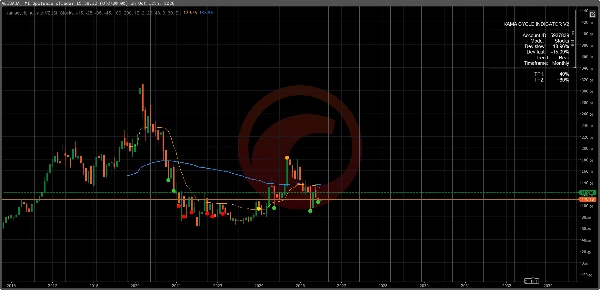
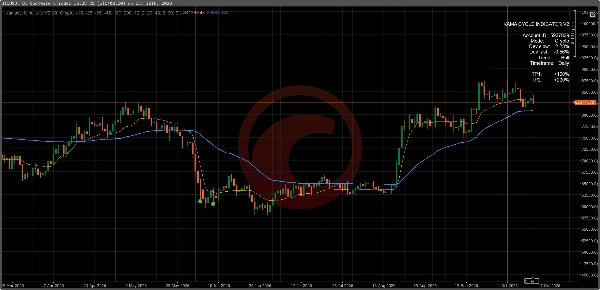
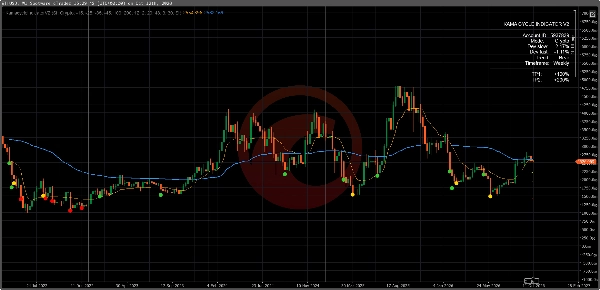
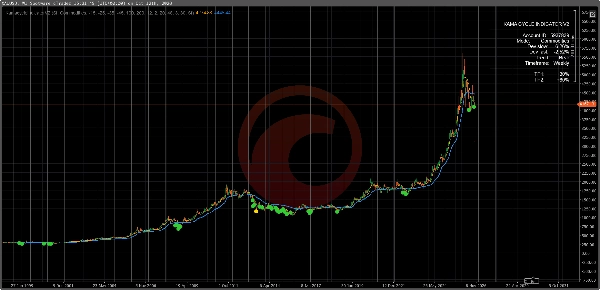
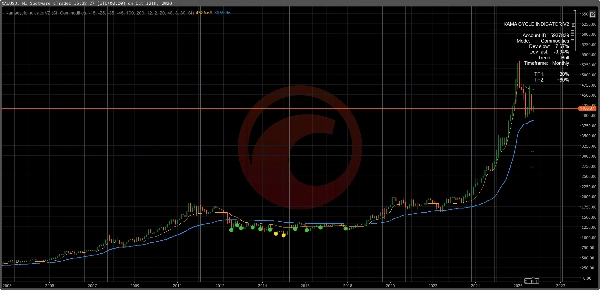
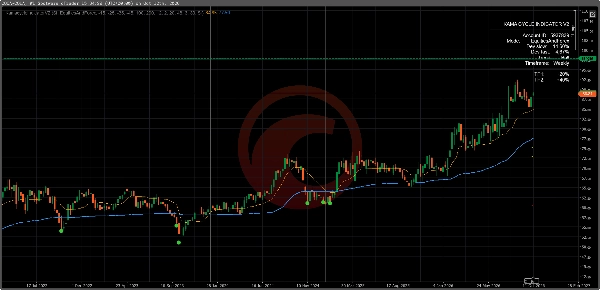
SukunaTactical is an advanced quantitative trading indicator built on a dual Kaufman Adaptive Moving Average (KAMA) system. It calculates real-time percentage price deviations to spot high-probability accumulation zones and profit targets across various market conditions.


---


### ⏱️ Recommended Timeframes (Medium to Long Term)


This indicator is specifically engineered for **medium-to-long-term trend following and strategic accumulation**:

* **Recommended Timeframes:** Daily (D1), Weekly (W1), and Monthly (MN1).

* **Best Usage:** Designed to capture major market cycles, macro dip-buying opportunities, and long-term tops. *(Not recommended for short-term scalping or intraday noise).*


---


### 🎯 DCA & Portion Allocation Strategy


The **Buy L1 – L4** signals are designed for structured **Dollar-Cost Averaging (DCA)**:

* **Position Sizing / Scaling-In:** Instead of buying all at once, allocate your total capital in tranches as price reaches progressively deeper deviation levels (L1 = initial entry, L4 = maximum accumulation depth).

* **Disciplined Risk Management:** Helps reduce average entry price during major market pullbacks without overexposing capital upfront.


---


### 🌟 Key Features


* **Built-in Multi-Asset Presets:** Optimized default parameters for Crypto, Stocks, Commodities, and Equities/Forex.

* **Custom Mode:** Fully customizable deviation levels for custom tuning.

* **4 Accumulation Buy Levels (Buy L1 - L4):** Clear visual markers for dip-buying and DCA scaling.

* **2 Take-Profit Targets (TP1 - TP2):** Exit signals based on fast KAMA volatility expansion.

* **Live On-Chart Dashboard:** Real-time display showing current trend bias, fast/slow deviations, and active timeframe.


---


### πŸ“Š Built-in Deviation Presets


- **Crypto:** Buy (-15%, -25%, -35%, -45%) | TP (+100%, +200%)

- **Stocks:** Buy (-10%, -20%, -30%, -40%) | TP (+40%, +80%)

- **Commodities:** Buy (-5%, -10%, -20%, -30%) | TP (+30%, +60%)

- **Equities & Forex:** Buy (-3%, -6%, -12%, -22%) | TP (+20%, +40%)


---


### πŸ”’ License, Support & Contact

* **Activation:** After purchase, please provide your cTrader Account ID to activate your personal license.


Summary

AI summary
KamacycleIndicatorV2 is an advanced trading indicator based on a dual Kaufman Adaptive Moving Average (KAMA) system. It calculates real-time percentage price deviations to identify high-probability accumulation zones and profit targets, supporting medium- to long-term trend following on daily, weekly, and monthly timeframes. The indicator is designed to capture major market cycles, macro dip-buying opportunities, and long-term tops.

Key features include automated multi-asset presets optimized for cryptocurrencies, stocks, commodities, and equities/forex, as well as a customizable mode for fine-tuning deviation levels. It provides four accumulation buy levels (Buy L1 to L4) to facilitate structured dollar-cost averaging (DCA) by scaling position sizes as prices reach deeper deviation levels, helping manage risk and reduce average entry price during pullbacks. Two take-profit targets (TP1 and TP2) are based on fast KAMA volatility expansion.

A live on-chart dashboard displays current trend bias, fast/slow deviations, and active timeframe. Built-in deviation presets specify buy and take-profit levels tailored to different asset classes, for example, crypto buy levels range from -15% to -45% with take profits at +100% and +200%. The indicator outputs signals and visualizations to assist traders in identifying trend strength and potential reversals.
Indicator profile
Indicator category
Trend
Output type
Signals
Visualisation
Data requirements
Bars only
Supported signals
Reversal
Trend strength

Discussion

Customer reviews

0.0
Reviews: 0
Customer reviews
No reviews for this product yet. Already tried it? Be the first to tell others!

FAQ

Premium/Discount
Supply & Demand
Products available through cTrader Store, including trading bots, indicators and plugins, are provided by third-party developers and made available for informational and technical access purposes only. cTrader Store is not a broker and does not provide investment advice, personal recommendations or any guarantee of future performance.

You may also like

Indicator
Volume
Channel
+2
Identify key support and resistance levels through detailed volume distribution analysis.
Indicator
EURUSD
GBPUSD
+3
All-in-one suite for ICT concepts: NY Midnight Open, Killzones, automatic Liquidity levels (PDH/L, PWH/L).
Indicator
EMA
Supertrend
+4
Dynamic dual MA cloud indicator. Identifies trends, crossovers, and pullback entries in real time for any asset.
Indicator
RSI
SMC
+17
Turn WaveTrend Cross into a BTC profit machine precise buy sell signals, smart momentum edge, no lag trading system
Indicator
Forex
Enhance your trading strategy with automated detection and alerts for key chart patterns.
Indicator
Forex
Crypto
+5
The best filter for trading trend continuations on Renko charts.
Indicator
Volume
Key Levels
View tick activity across a selected chart range with Point of Control, Value Area High and Value Area Low.
Indicator
SMC
Prop
+5
Order Block PRO β€” Smart Institutional Zone Detector
Indicator
ATR
Volume
+3
Volume profile key levels - POC, value area, volume peaks and troughs - with break, rejection and retest signals
Indicator
Prop
Forex
+11
🌊 See when the market is truly in play. Tsunami measures Relative Volume by time-of-day 🌊
Indicator
Forex
EURUSD
+7
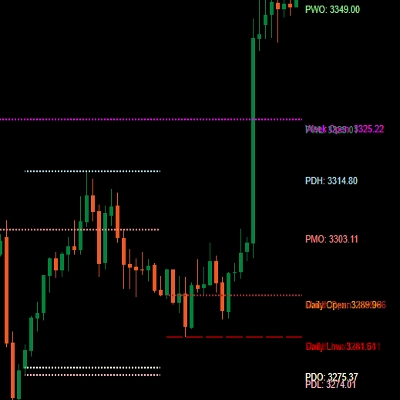
Institutional Session Levels Pro OHLC,Prev(D,W,M OHLC)
Indicator
BOS
Imbalance
+4
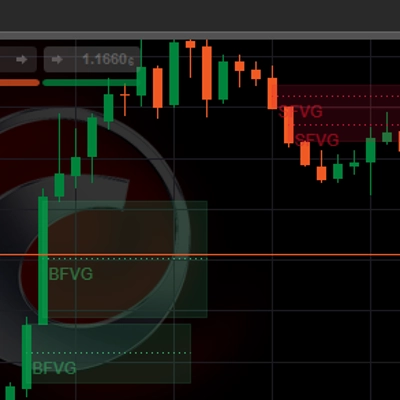
Automatically detects and highlights both Bullish and Bearish Fair Value Gaps (FVGs).
Indicator
Imbalance
Key Levels
+4
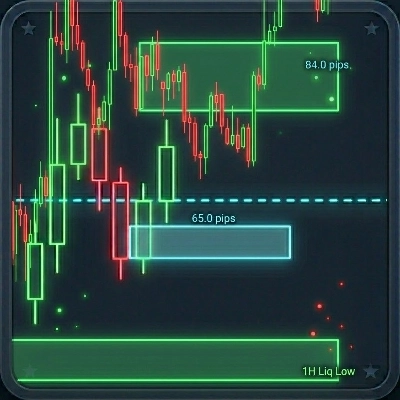
This indicator combines Multi-Timeframe Liquidity tracking, a dynamic Fair Value Gap (FVG) and a 50% Daily Range
Indicator
Risk Dashboard
AI-powered daily range forecasts help traders spot volatility opportunities and plan stops and targets.
Indicator
Forex
Crypto
+5
Γ°ΒŸΒšΒ€ Automated Elliott Wave & Fibonacci tool for cTrader. Spot trends, corrections & retracements fast.
Indicator
BOS
EMA
+5
Market structure signals graded A to C, each with a drawn trade plan, plus an adaptive trend ribbon and a trend matrix
Indicator
ATR
BOS
+5
Market structure with BOS and CHoCH, order blocks, and retest buy/sell arrows with entry, stop and two targets
Indicator
Volume
Key Levels
+2
Footprint-style volume profile with live order-flow delta (tape + DOM), buy/sell zones, POC/VAH/VAL and HVN/LVN nodes.

Price

Since 12/06/2026