
Descrição
⚠️ Nós mudamos para 👉 PrimeQuant
🚫🚫🚫 Não compre este indicador!
⚡ VERSÃO DE PRÓXIMA GERAÇÃO DISPONÍVEL: Esta ferramenta clássica LudwigICT foi redesenhada, reestruturada e relançada sob nossa nova marca de desenvolvedor, PrimeQuant. A nova versão apresenta uma interface simplificada e propriedades atualizadas para as condições atuais do mercado. Obtenha a versão atualizada com desconto aqui:
👉 Liquidity Sweep True Channel
👉 Liquidity Sweep True Channel
👉 Liquidity Sweep True Channel
(Por favor, note: a listagem LudwigICT permanece ativa para usuários legados, mas não receberá mais atualizações ou descontos ativos.)
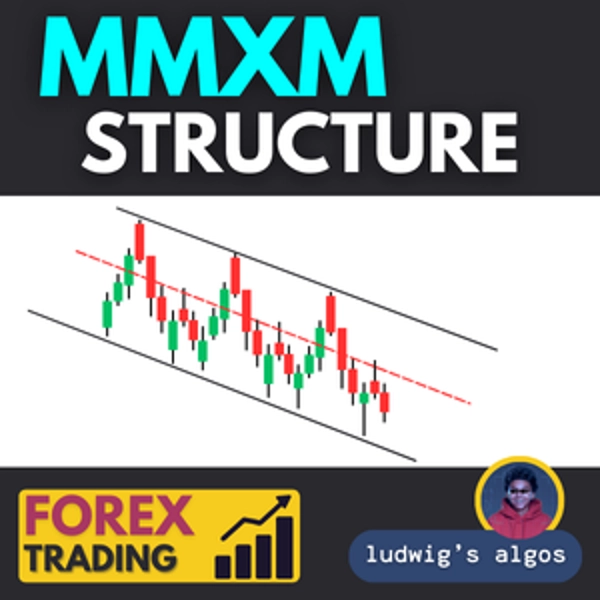
Esta Estrutura MMXM é essencialmente uma ferramenta de mapeamento de swings da estrutura de mercado que os traders podem usar para identificar configurações de venda (ou configurações de compra) com base em máximas/mínimas de swing e extremos de preço.
A Estrutura MMXM é uma ferramenta avançada de análise de ação de preço projetada para mapear a estrutura do mercado e destacar oportunidades potenciais de negociação com precisão.
Este indicador detecta e marca automaticamente máximas de swing e mínimas de swing ao longo de um período configurável de retrocesso, conectando-os com uma estrutura ZigZag para tornar a direção do mercado e as mudanças estruturais imediatamente visíveis.
Para configurações do lado de venda, o indicador enfatiza extremidades superiores do mercado onde o preço atingiu pontos significativos de resistência ou exaustão. Estes são exibidos em vermelho, servindo como níveis de referência potenciais para entrada em posições vendidas. A ferramenta também projeta linhas de extremidade do envelope do corpo, mostrando o alcance máximo e mínimo do corpo da vela dentro de um swing, permitindo que os traders avaliem se o preço está estendido demais antes da reversão.
Principais Características:
- Detecção Automática de Swings: Identifica e marca máximas e mínimas pivôs sem artefatos de repintura com atraso.
- Visualização da Estrutura ZigZag: Conecta pontos pivôs para facilitar a leitura do fluxo de tendência e quebras estruturais.
- Marcadores de Extremidade Superior (Foco em Venda): Destaca máximas significativas que podem servir como zonas de oferta ou resistência.
- Extremidades do Envelope do Corpo: Plota linhas pontilhadas de referência acima e abaixo dos swings para medir a extensão do preço.
- Projeção da Linha de Extensão: Opcionalmente estende a linha do último swing até a barra atual para acompanhamento ao vivo do preço.
- Opção de Rotulagem: Exibe níveis exatos de preço nos pontos de swing para mira precisa.
- Aparência Personalizável: Cores, comprimentos e opções de exibição ajustáveis para estilos de negociação individuais.
Como Usar para Venda ou Compra:
- Espere que um marcador de extremidade superior (vermelho) se forme em uma máxima ou mínima significativa.
- Confirme a reversão potencial com confluência adicional (por exemplo, vela de rejeição, divergência ou nível chave).
- Use a extremidade e a linha de tendência ZigZag como referência de resistência.
- Entre em posições vendidas ou compradas com stops acima da última máxima ou mínima de swing e alvos definidos próximos à próxima mínima ou máxima de swing ou quebra estrutural.
Se você tiver alguma dúvida ou encontrar algum problema, sinta-se à vontade para me contatar. Ficarei feliz em ajudar você!
Aviso Legal:
Ao usar meus algoritmos, você reconhece que a negociação envolve riscos inerentes e que o desempenho passado não garante resultados futuros. É essencial que você tenha uma estratégia sólida de gerenciamento de risco e, acima de tudo, que permaneça disciplinado em aderir aos níveis de stop-loss. A falha em gerenciar o risco adequadamente pode levar a perdas significativas. Não sou responsável por quaisquer resultados financeiros decorrentes do uso destes algoritmos. Negocie com responsabilidade e sempre siga as práticas adequadas de gerenciamento de risco.
Fique abençoado! 🙌
Resumo
Avaliações de clientes
5 | 33 % | |
4 | 67 % | |
3 | 0 % | |
2 | 0 % | |
1 | 0 % |


