Deskripsi
MTC Akademika Harmonics
Struktur pasar harmonik, dibaca melalui lensa *Monadology* Leibniz — dalam interpretasi pribadi David Murawski, der Mustermann.
Deskripsi Singkat
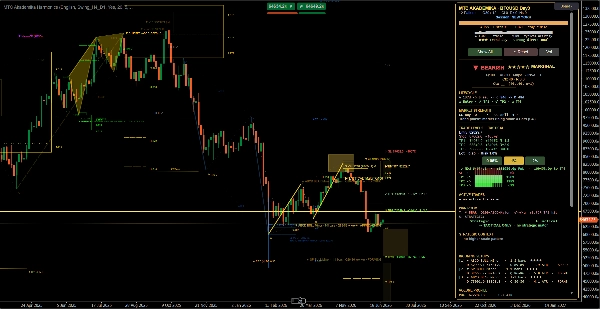
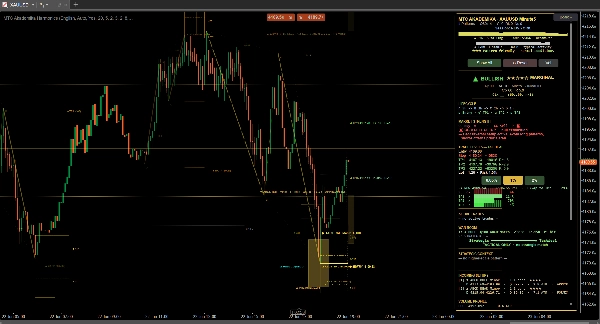
MTC Akademika Harmonics adalah overlay grafik yang dibangun berdasarkan satu keyakinan: harga bukanlah kebisingan, melainkan plenum refleksi. Berdasarkan prinsip *Monadology* Gottfried Wilhelm Leibniz — dalam interpretasi pribadi David Murawski, der Mustermann selama bertahun-tahun — ini mengungkap di mana struktur harmonik pasar mencapai kesepakatan di setiap skala, dan merangkum bacaan itu ke dalam satu dashboard yang tenang dan profesional. Ini adalah alat analisis dan visualisasi diskresioner, bukan sistem otomatis atau layanan sinyal.
Idenya
Pada tahun 1714 Leibniz mengusulkan bahwa realitas terdiri dari unit-unit sederhana yang tak terbagi — *monad* — yang masing-masing mencerminkan seluruh alam semesta dari sudut pandangnya sendiri, dan bahwa keteraturan yang kita alami muncul dari *harmoni yang telah ditetapkan sebelumnya* di antara mereka. Tidak ada yang, menurutnya, ada tanpa *alasan yang cukup*.
Indikator ini menerapkan pandangan dunia itu pada grafik. Setiap struktur, dari ayunan paling samar hingga pergerakan terbesar, diperlakukan sebagai refleksi dari satu keseluruhan yang sama — bagian yang terkandung dalam keseluruhan, keseluruhan yang tercermin dalam bagian. Makna tidak diambil dari sinyal tunggal mana pun; ia muncul pada saat-saat di mana refleksi independen jatuh dalam harmoni. Dan tidak ada titik balik yang sewenang-wenang — masing-masing membawa alasannya dalam struktur yang menghasilkannya.
Ini bukan pemindai pola generik. Ini adalah distilasi satu penulis dari ide berumur tiga ratus tahun menjadi sebuah instrumen yang melakukan pengamatan untuk Anda.
Apa yang Anda Dapatkan:
- **Satu bacaan koheren di setiap skala** — ayunan terkecil dan pergerakan terbesar dalam satu grafik, sehingga Anda melihat struktur bukan kekacauan.
- **Momen harmoni, ditandai untuk Anda** — situasi langka di mana refleksi independen selaras ditampilkan dan disorot, sehingga konteks terkuat menonjol dengan sendirinya.
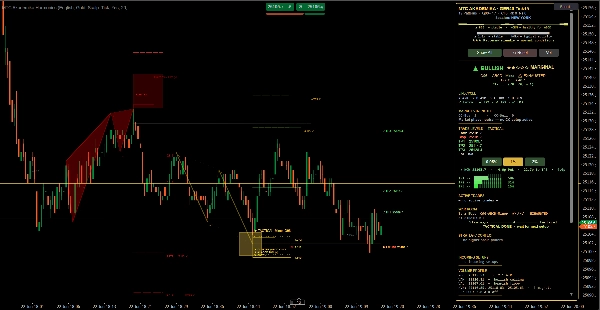
- **Setup lengkap dan dapat dibaca** — untuk setiap struktur: zona jelas, target yang diproyeksikan dan stop pelindung, dengan rasio imbalan terhadap risiko yang terlihat sekilas.
- **Dashboard perintah profesional (War Room / Modern UI)** — arah, keyakinan, konteks pasar dan gambaran multi-timeframe, dirangkum dalam satu panel.
- **Siklus hidup sekilas** — setiap struktur diberi tag *live*, *spent* atau *invalid*, sehingga Anda selalu tahu apa yang masih layak mendapat perhatian dan apa yang harus diabaikan.
- **Tampilan risiko bawaan** — ukuran posisi dari ukuran akun Anda dan risiko per perdagangan, ditampilkan dalam mata uang akun Anda.
- **Kesadaran dan peringatan multi-timeframe** — bacaan timeframe lebih tinggi, plus peringatan opsional untuk struktur baru dan sentuhan kunci.
- **Tutorial terpandu dalam tujuh bahasa** — mengajarkan filosofi dan panel saat Anda menggunakannya.
Untuk Siapa Ini
Trader diskresioner yang berpikir dalam struktur daripada indikator; yang menginginkan gambaran yang tenang dan terpadu daripada dinding peringatan; dan yang menghargai bahwa instrumen terbaik menyembunyikan mekanismenya dan hanya menunjukkan apa yang penting.
Tentang Metode
Bagaimana harmoni diukur, bagaimana skala berhubungan, bagaimana bacaan dibentuk — ini adalah hasil dari penelitian pribadi yang panjang dan, sesuai desain, tidak diungkapkan. Anda memperoleh penilaian, bukan resep.
Kompatibilitas
Berjalan sebagai overlay grafik pada **simbol apa pun dan timeframe apa pun** (termasuk grafik tick). Antarmuka dalam bahasa Inggris, Jerman, Spanyol, Italia, Prancis, Rusia, dan Portugis.
Risiko
MTC Akademika Harmonics adalah alat analisis dan visualisasi diskresioner, bukan sistem perdagangan otomatis atau layanan sinyal. Ini menyoroti struktur dan konteks; keputusan untuk berdagang, dan pengelolaan risiko, sepenuhnya menjadi tanggung jawab Anda. Perdagangan membawa risiko kerugian. Hasil masa lalu tidak menjamin hasil di masa depan.