Açıklama
Geliştirilmiş MACD Histogramı ile tanışın, daha net ve daha içgörülü bir ticaret deneyimi sunmak için tasarlandı.
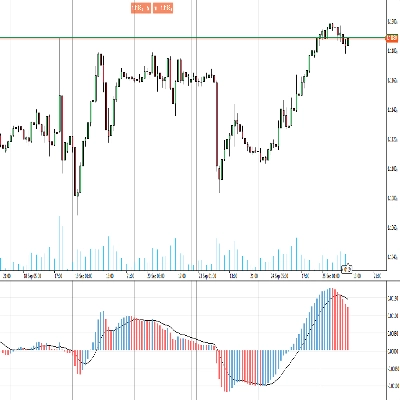
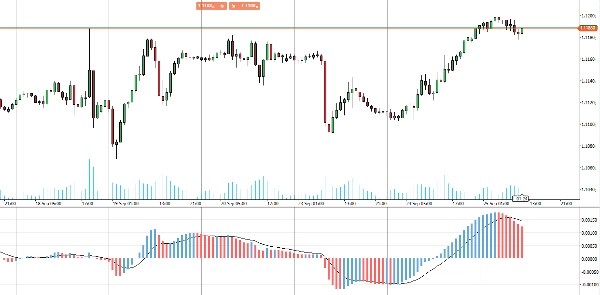
Bu yükseltilmiş gösterge, boğa ve ayı fiyat değişikliklerini ayırt eden canlı, renkli bir histogram gösterir ve varsayılan tek renkli formatın ötesine geçer. Pozitif ve negatif hareketler için farklı renkler kullanarak, piyasa koşullarına anında görsel bir ipucu sunar, böylece momentum değişimlerini ve potansiyel trend dönüşlerini yorumlamayı kolaylaştırır.
Daha fazla netlik ve hassasiyet arayan tüccarlar için mükemmel olan bu MACD Histogramı yükseltmesi, grafiğinizi daha güçlü bir analiz aracına dönüştürür. Geliştirilmiş MACD Histogramı ile ticaret stratejinizi yükseltin.
Özet
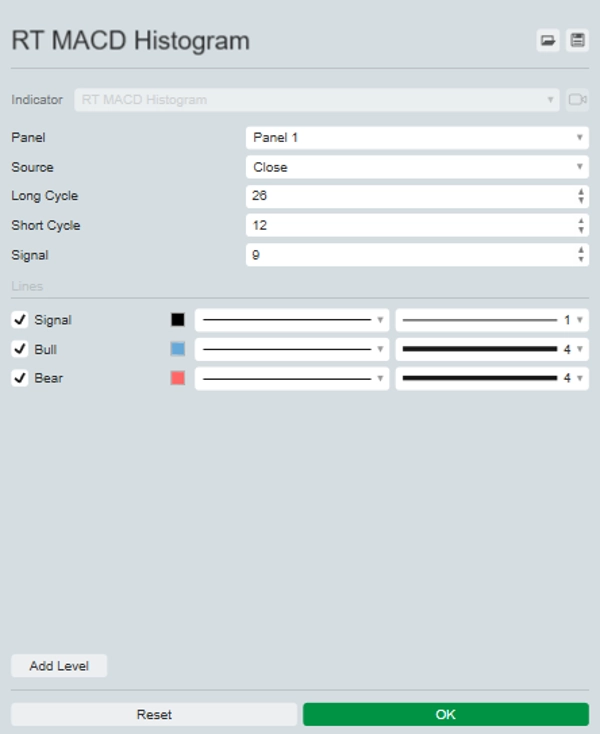
Gösterge profili
Müşteri değerlendirmeleri
0.0
Değerlendirmeler: 0
Müşteri değerlendirmeleri
Bu ürün için henüz bir değerlendirme yok. Ürünü denediniz mi? O zaman ona dair görüşlerini paylaşan ilk kişi olun!
Tartışma
SSS
BTCUSD
Forex
Signal
Indices
EURUSD
Commodities
GBPUSD
NZDUSD
Prop
Scalping
Crypto
Stocks
XAUUSD
NAS100
MACD
USDJPY
cTrader Store üzerinden erişilebilen işlem botları, göstergeler ve eklentiler gibi ürünler, üçüncü taraf sağlayıcılar tarafından sağlanır ve yalnızca bilgilendirme ve teknik erişim amaçlarıyla sunulur. cTrader Store bir broker değildir ve yatırım tavsiyesi, kişisel öneriler vermez veya gelecekteki performansı garanti etmez.


Fiyat
Başlangıç 25/09/2024
20
Satışlar