الوصف
استراتيجية SuperTrend**
استراتيجية **SuperTrend** هي استراتيجية تداول شائعة تعتمد على مؤشر فني يحمل نفس الاسم (**مؤشر SuperTrend**). يُستخدم هذا المؤشر لتحديد اتجاهات السوق (صعود أو هبوط) وتوفير إشارات دخول وخروج واضحة. وهو معروف ببساطته وفعاليته في الأسواق ذات الاتجاهات.
---
### **مكونات مؤشر SuperTrend**
1. **المتوسط الحقيقي المدى (ATR)**:
- يُستخدم لقياس تقلبات السوق.
- كلما زادت التقلبات، زادت قيمة ATR.
2. **المضاعف**:
- عامل يُضرب في قيمة ATR لتحديد مسافة خط SuperTrend عن السعر.
- القيمة الافتراضية عادة ما تكون بين 2 و 4.
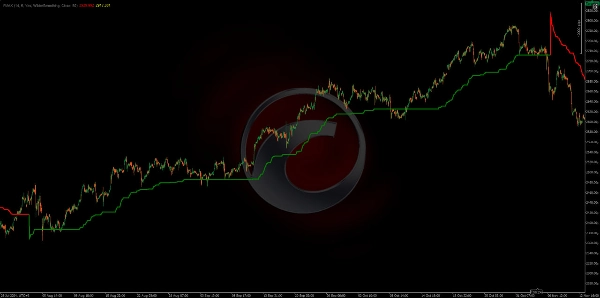
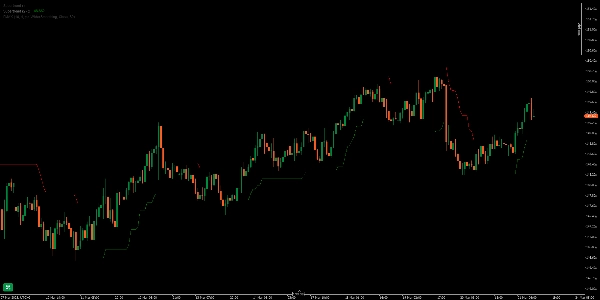
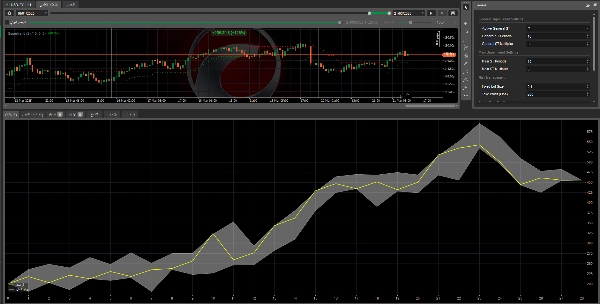
3. **خط SuperTrend**:
- خط ديناميكي يتكيف بناءً على تحركات السعر.
- إذا كان السعر فوق الخط، يُعتبر الاتجاه صاعدًا.
- إذا كان السعر تحت الخط، يُعتبر الاتجاه هابطًا.
---
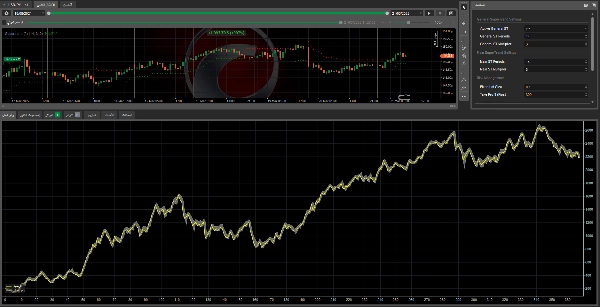
### **كيف يعمل مؤشر SuperTrend؟**
1. **الاتجاه الصاعد**:
- عندما يكون السعر فوق خط SuperTrend، يُعتبر الاتجاه صاعدًا.
- يُرسم الخط أسفل السعر، ليعمل كدعم ديناميكي.
- إشارة شراء: عندما يعبر السعر فوق خط SuperTrend.
2. **الاتجاه الهابط**:
- عندما يكون السعر تحت خط SuperTrend، يُعتبر الاتجاه هابطًا.
- يُرسم الخط فوق السعر، ليعمل كمقاومة ديناميكية.
- إشارة بيع: عندما يعبر السعر تحت خط SuperTrend.
---
### **إعدادات المؤشر**
- **فترة ATR**: عادة ما تُضبط على 10 (يمكن تعديلها حسب الإطار الزمني).
- **المضاعف**: عادة ما يُضبط على 3 (يمكن تعديله لزيادة أو تقليل الحساسية).
---
### **مزايا استراتيجية SuperTrend**
1. **سهولة الاستخدام**: المؤشر بسيط ويوفر إشارات واضحة.
2. **فعال في الأسواق ذات الاتجاهات**: يعمل جيدًا في الأسواق التي تتميز باتجاهات قوية.
3. **نقاط دخول وخروج واضحة**: يوفر إشارات دقيقة للدخول والخروج من الصفقات.
4. **قابل للتخصيص**: يمكن تعديل فترة ATR والمضاعف لتناسب أسلوب التداول الخاص بك.
---
### **عيوب استراتيجية SuperTrend**
1. **غير فعالة في الأسواق الجانبية**:
- في الأسواق الجانبية أو المتذبذبة، قد ينتج المؤشر إشارات خاطئة.
2. **إشارات متأخرة**:
- مثل معظم مؤشرات تتبع الاتجاه، قد يتأخر أثناء تحركات السعر السريعة.
---
### **كيفية استخدام SuperTrend في التداول**
1. **أضف المؤشر إلى الرسم البياني الخاص بك**:
- أضف مؤشر SuperTrend إلى الرسم البياني الخاص بك.
- قم بضبط فترة ATR والمضاعف حسب تفضيلاتك.
2. **إشارات الشراء**:
- عندما يعبر السعر فوق خط SuperTrend ويتحول الخط إلى اللون الأخضر، تكون هذه إشارة شراء.
- ضع وقف خسارة أسفل خط SuperTrend.
3. **إشارات البيع**:
- عندما يعبر السعر تحت خط SuperTrend ويتحول الخط إلى اللون الأحمر، تكون هذه إشارة بيع.
- ضع وقف خسارة أعلى خط SuperTrend.
4. **إدارة الصفقات**:
- استخدم خط SuperTrend كدليل للخروج من الصفقات.
- أغلق الصفقة عندما يغير المؤشر اتجاهه.
---
### **نصائح لتحسين الأداء**
1. **الدمج مع أدوات أخرى**:
- دمج SuperTrend مع مؤشرات أخرى مثل **المتوسطات المتحركة** أو **RSI** لتأكيد الإشارات.
2. **التعديل حسب الإطار الزمني**:
- استخدم إعدادات مختلفة للأطر الزمنية اليومية والأقصر.
3. **إدارة المخاطر**:
- استخدم دائمًا مستويات وقف الخسارة وجني الأرباح لتقليل الخسائر.
---
### **الخلاصة**
استراتيجية SuperTrend هي أداة قوية وفعالة لتحديد الاتجاهات وتوليد إشارات تداول واضحة. ومع ذلك، يجب استخدامها بحذر ودمجها مع أدوات أخرى لتحسين الدقة. هذه الاستراتيجية مثالية للمتداولين الذين يفضلون التداول في الأسواق ذات الاتجاهات القوية.