Market Swing Structure Pullback Pro
Chỉ báo
Phiên bản 1.0, Sep 2025
Windows, Mac
Mô tả
"Giao dịch có rủi ro. Hiệu suất trong quá khứ không đảm bảo kết quả trong tương lai."
Tóm tắt
Tóm tắt AI
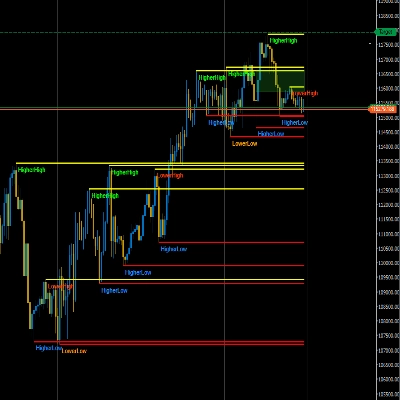
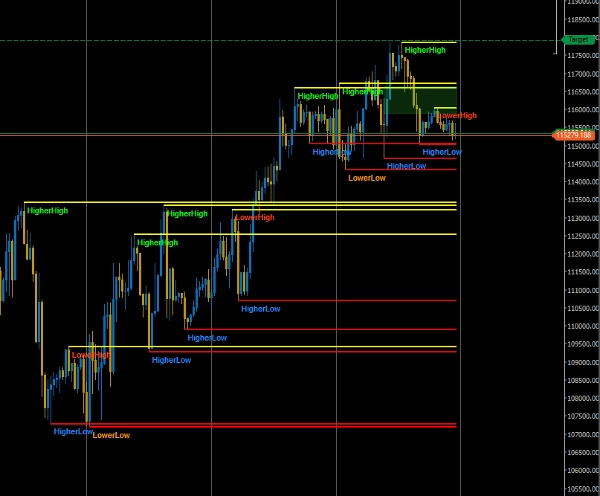
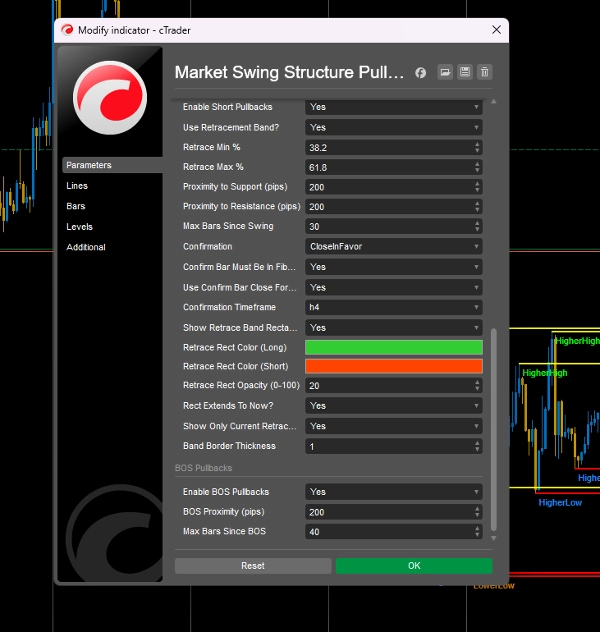
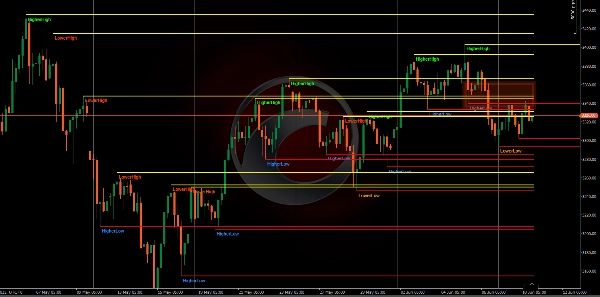
Market Swing Structure Pullback Pro is a trading indicator designed to automatically detect key market levels such as support and resistance and structural points. It highlights pullbacks and break of structure (BOS) retests, providing visual cues for potential trade entries. The indicator incorporates candle confirmation to filter signals, aiming to improve the accuracy of trade setups. It supports multiple markets including Forex, cryptocurrencies (e.g., BTCUSD, ETH), commodities (e.g., gold, oil), indices (e.g., NAS100, SP500), and stocks. Key features include automatic identification of swing structures, highlighting of pullback zones, and integration of candle pattern validation. This tool is intended for use on various symbols and timeframes to assist traders in identifying potential reversal or continuation points based on market structure analysis.
Hồ sơ chỉ báo
Đánh giá của khách hàng
0.0
Đánh giá: 0
Đánh giá của khách hàng
Sản phẩm này chưa có đánh giá nào. Bạn đã dùng thử chưa? Hãy là người đầu tiên chia sẻ với mọi người!
Thảo luận
Câu hỏi thường gặp
BTCUSD
Forex
Signal
Breakout
Indices
EURUSD
Commodities
GBPUSD
NZDUSD
Prop
Supertrend
Crypto
Stocks
XAUUSD
NAS100
USDJPY
Các sản phẩm có sẵn trên cTrader Store, bao gồm bot giao dịch, chỉ báo và plugin, được cung cấp bởi các nhà phát triển bên thứ ba và chỉ nhằm mục đích cung cấp thông tin và tiếp cận kỹ thuật. cTrader Store không phải là nhà môi giới và không cung cấp lời khuyên đầu tư, khuyến nghị cá nhân hay bất kỳ đảm bảo nào về hiệu suất trong tương lai.


![Logo "Wyckoff Toolkit [Iridio Capital]"](https://cdn.ctrader.com/image/webp/8acfe6a1-6a8e-4578-9367-9df3af2b1801_27763)


Giá
Kể từ 31/10/2024
56
Lượt bán
1.75K
Cài đặt miễn phí