Описание
🎯 ИНТЕЛЛЕКТ МНОГОКРАТНОГО ВОЛАТИЛЬНОГО ТАЙМФРЕЙМА
Перестаньте пропускать прорывы волатильности — смотрите все таймфреймы одновременно
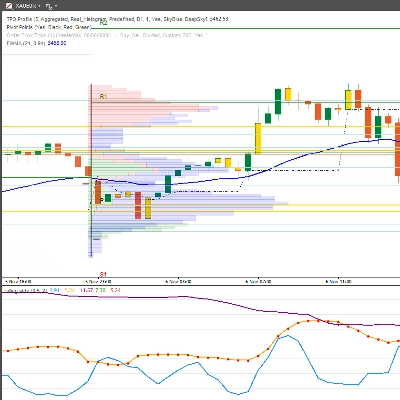
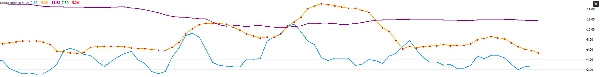
Большинство индикаторов волатильности показывают вам только одну перспективу. Наш Индикатор скользящей волатильности с несколькими таймфреймами дает вам полную картину по краткосрочным (7), среднесрочным (21) и долгосрочным (63) периодам — с встроенными торговыми сигналами, которые точно подскажут, когда действовать.
⚡ ПОЧЕМУ МНОГОКРАТНАЯ ВОЛАТИЛЬНОСТЬ МЕНЯЕТ ВСЁ
Один таймфрейм против нашего подхода с несколькими таймфреймами:
- ❌ Один период: Видите деревья, но пропускаете лес
- ✅ Три периода: Полный ландшафт волатильности с контекстом
Реальные торговые сценарии:
- Краткосрочный всплеск при долгосрочном спокойствии → Временной шум (игнорировать)
- Все таймфреймы растут → Подлинное изменение режима (действовать)
- Краткосрочное спокойствие на фоне долгосрочного хаоса → Ложное спокойствие (осторожно)
🎯 ПРОФЕССИОНАЛЬНЫЕ ФУНКЦИИ
✨ ВИДИМОСТЬ В ТРЕХ ТАЙМФРЕЙМАХ
- StdDev 7: Отслеживайте мгновенные изменения волатильности (внутридневные)
- StdDev 21: Среднесрочная волатильность (свинг-трейдинг)
- StdDev 63: Долгосрочный контекст волатильности (позиционный трейдинг)
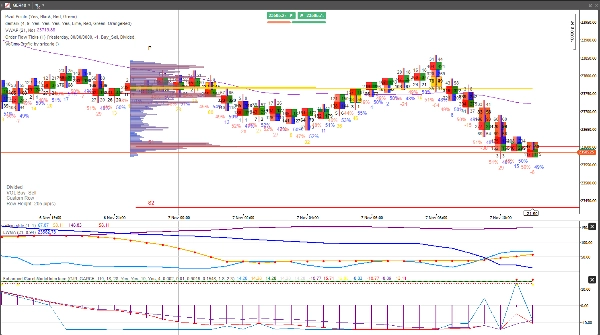
🚦 АВТОМАТИЧЕСКИЕ ТОРГОВЫЕ СИГНАЛЫ
- Зеленые стрелки покупки: Возможности сжатия волатильности
- Красные стрелки продажи: Предупреждения о расширении волатильности
- Умные пороги: Настраиваемые уровни покупки/продажи
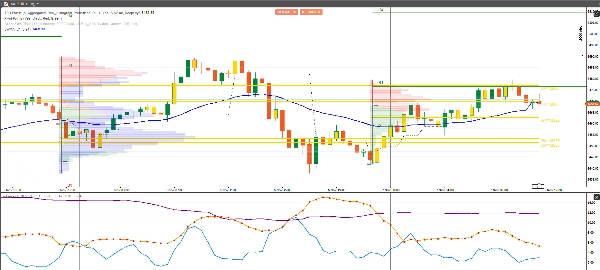
📊 ПРОДВИНУТЫЙ АНАЛИЗ ВОЛАТИЛЬНОСТИ
- Пересечения волатильности: Пересечение линий StdDev = смена режимов
- Сигналы возврата к среднему: Волатильность возвращается к среднему
- Обнаружение всплесков: События экстремальной волатильности
💡 ИДЕАЛЬНО ДЛЯ ЭТИХ СТИЛЕЙ ТРЕЙДИНГА:
🎯 Трейдеры прорывов волатильности
- Входите во время низкой волатильности перед взрывными движениями
- Выходите во время высокой волатильности перед разворотами
- Точно рассчитывайте время входа с помощью тройного подтверждения
📈 Трейдеры возврата к среднему
- Уверенно гасите экстремумы волатильности
- Определяйте перекупленные рыночные условия
- Используйте волатильность как контртрендовый индикатор
🛡 Трейдеры, избегающие рисков
- Полностью избегайте периодов высокой волатильности
- Торгуйте только в спокойных, предсказуемых рынках
- Используйте волатильность для определения размера позиции
📊 Трейдеры опционов
- Продажа временной премии во время высокой волатильности
- Покупка опционов во время сжатия волатильности
- Анализ IV и HV для выявления неправильного ценообразования
Встроенные умные сигналы:
- ✅ Покупать, когда: Волатильность опускается ниже порога ИЛИ пересекает скользящую среднюю сверху вниз
- ✅ Продавать, когда: Волатильность резко поднимается выше порога ИЛИ пересекает скользящую среднюю снизу вверх
📈 ЧТО ВЫ ПОЛУЧАЕТЕ:
✅ Видимость в трех таймфреймах - Больше никаких догадок о контексте волатильности
✅ Автоматические сигналы покупки/продажи - Четкие визуальные стрелки в оптимальных точках
✅ Обнаружение режимов волатильности - Знайте, когда рынки спокойны или хаотичны
✅ Настраиваемые пороги - Адаптируйтесь к любому стилю торговли или активу
✅ Профессиональное цветовое кодирование - Мгновенное визуальное понимание
💰 СПЕЦИАЛЬНАЯ СТАРТОВАЯ ЦЕНА: $50
(Обычная цена: $100)
Разбивка стоимости:
- Индикатор StdDev 7: стоимость $29
- Индикатор StdDev 21: стоимость $29
- Индикатор StdDev 63: стоимость $29
- Торговые сигналы: стоимость $49
- Общая стоимость: $136
- Ваша цена: $50 (Экономия 35%)
Включено: Полный индикатор + пожизненные обновления + приоритетная поддержка
Гарантия возврата денег в течение 30 дней - Если это не улучшит ваше тайминг волатильности, мы вернем каждый цент.
🎁 БОНУС: Бесплатное руководство по таймингу волатильности
Покупка включает "Мастерство волатильности с несколькими таймфреймами" - стоимость $39 БЕСПЛАТНО.
Включает:
- Стратегии торговли сжатия волатильности
- Методы подтверждения на нескольких таймфреймах
- Управление рисками в периоды волатильности
- Примеры сделок из реального мира
🚀 ГОТОВЫ ОВЛАДЕТЬ ТАЙМИНГОМ ВОЛАТИЛЬНОСТИ?
Нажмите "Добавить в корзину" и измените свое восприятие и торговлю рыночной волатильностью.
"Я перепробовал все индикаторы волатильности. Этот подход с тремя таймфреймами и встроенными сигналами — то, что я использую ежедневно в торговле в проп-фирме."
- Сара Родригес, профессиональный свинг-трейдер
ИДЕАЛЬНО ДЛЯ ЭТИХ РЫНКОВ:
📊 Акции и ETF
- Тайминг волатильности SPY, QQQ
- Ротация секторов на основе волатильности
- Игры на волатильности в отчетах о прибылях
💹 Валютные пары
- Анализ волатильности основных пар
- Оценка рисков carry trade
- Подтверждение прорывов
📈 Товары
- Циклы волатильности золота
- Всплески волатильности нефти
- Сезонная волатильность сельского хозяйства
🔄 Криптовалюты
- Режимы волатильности BTC/ETH
- Возможности волатильности альткоинов
- Управление рисками в крипто
Итог: Это не просто еще один индикатор стандартного отклонения. Это полноценная система тайминга волатильности, которая показывает вам точно, когда рынки собираются двигаться.
Ограниченное предложение при запуске: Первые 150 копий по $89 (экономия $30)
"Разница между любительской и профессиональной торговлей часто сводится к таймингу волатильности. Этот индикатор сокращает этот разрыв."
Добавьте в корзину сейчас → Начните торговать волатильностью как профессионал


