Описание
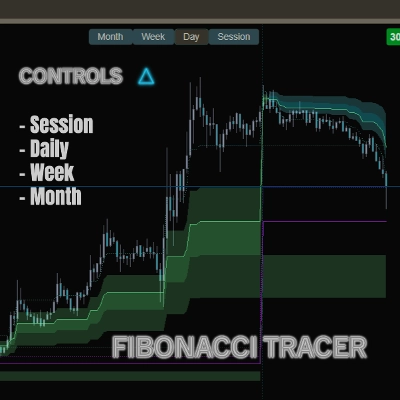
Fibonacci Tracer автоматически рисует и обновляет уровни Фибоначчи оставляя видимый след их развития.
Это позволяет видеть не только статичные уровни, но и то, как Фибоначчи развивается вместе с рынком со временем — что гораздо важнее, чем изолированные линии.
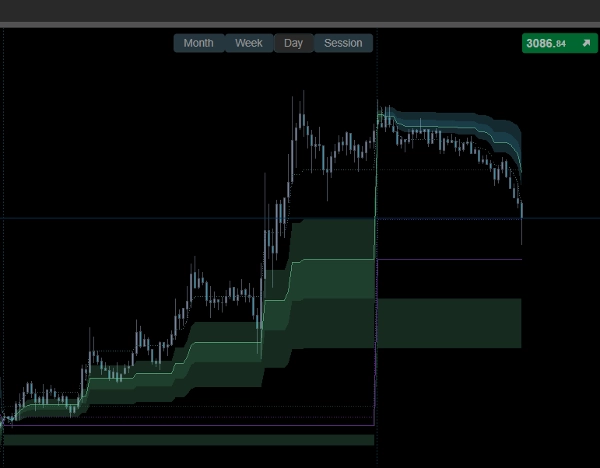
Быстрые кнопки управления на графике позволяют мгновенно переключаться между сессией, дневным, недельным и месячным просмотром, чтобы вы могли отслеживать, как Фибоначчи меняется в разных временных горизонтах.
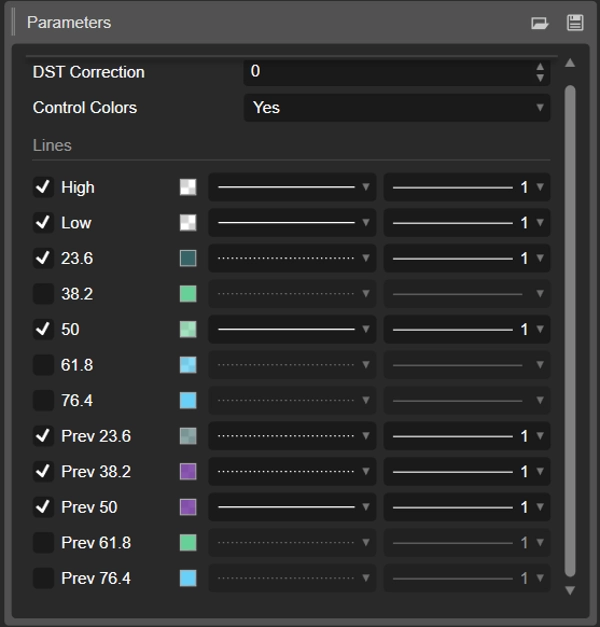
После включения индикатора откройте настройки и отключите флажки для линий (как показано на изображении ниже). Это убирает нежелательные точки и дает вам ту же мягкую, приятную для глаз схему, что и на обложке.
Большинство индикаторов упускают важные детали — они игнорируют рыночные переходы — выходные и ночной перенос, когда ликвидность сбрасывается до нуля — продолжая расчеты там, где на самом деле требуется сброс и новый рыночный анализ; это лишь небольшой фрагмент моего опыта, но понимание этого уже может изменить ваше восприятие рынков.
Сводка
Отзывы покупателей
5 | 50 % | |
4 | 50 % | |
3 | 0 % | |
2 | 0 % | |
1 | 0 % |


